© 1999 T
EXAS
I
NSTRUMENTS
I
NCORPORATED
TI-34 Û: A Guide for Teachers
89
Statistics
12
Keys
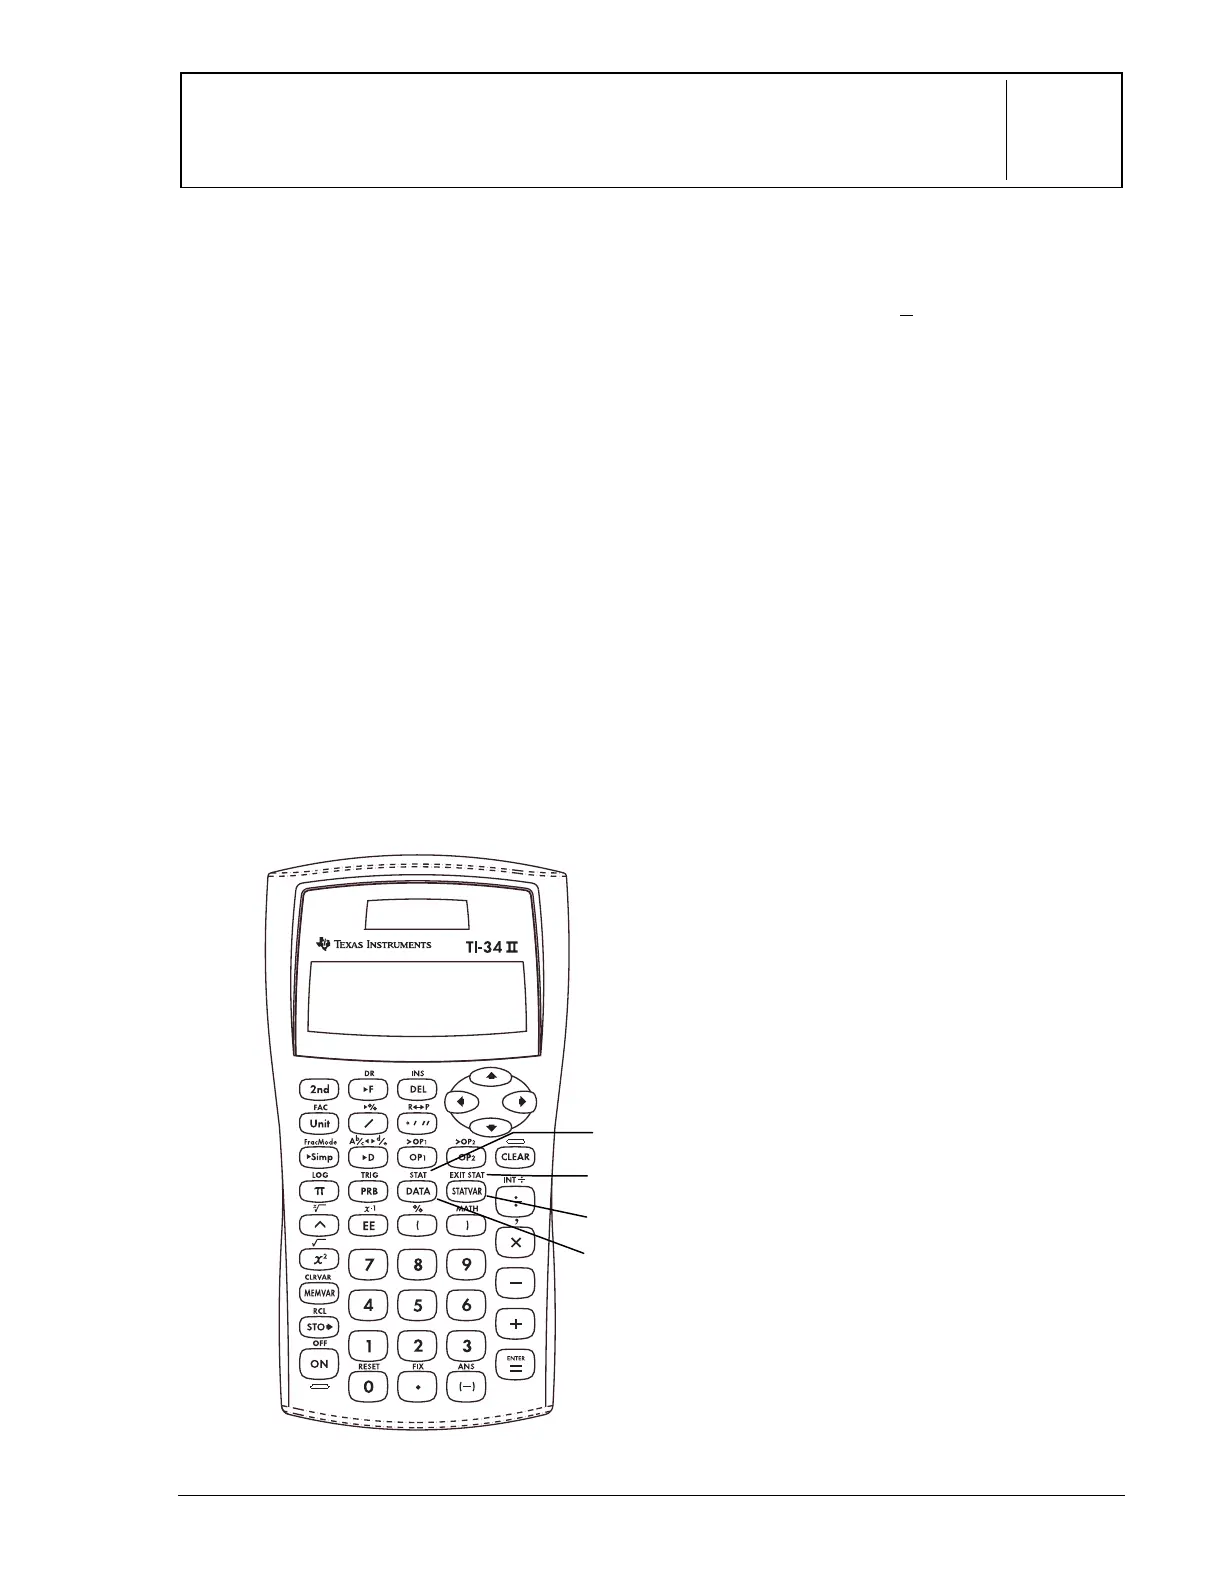
These numbered paragraphs provide
explanations for the corresponding numbered
keys on the illustration below.
1.
%t
displays a menu from which
you can select
1-VAR
,
2-VAR
or
CLRDATA
.
1-VAR
Analyzes data from 1 set
of data with 1 measured
variable: x.
2-VAR
Analyzes paired data with
2 measured variables: x,
the independent variable,
and y, the dependent
variable.
CLRDATA
Clears data values
without exiting STAT
mode.
2.
v
lets you enter data points (x for
1-VAR stats; x and y for 2-VAR stats).
3.
%w
displays the following
menu that lets you clear data values
and exit
STAT
mode.
EXIT ST: Y N
• Press
<
when
Y
(yes) is
underlined to clear data values and
exit STAT mode.
• Press
<
when
N
(no) is underlined
to return to the previous screen
without exiting STAT mode.
4.
u
displays the menu of
variables with their current values.
n
Number of x (or x,y) data
points
v or w Mean of all x or y values
Sx or Sy
Sample standard
deviation of x or y
sx or sy
Population standard
deviation of x or y
Gx or Gy
Sum of all x values or y
values
Gx
2
or Gy
2
Sum of all x
2
values or y
2
values
Gxy
Sum of (x times y) for all
xy pairs in 2 lists
a
Linear regression slope
b
Linear regression y-
intercept
r
Correlation coefficient
Notes
• The examples on the transparency
masters assume all default settings.
• To save the last data point or frequency
value entered, you must press
<
or
$
.
• You can change data points once they
are entered.
3
2
1
4
 Loading...