22 Using the Scratchpad
4. Change axis end values by double-clicking them and typing new
values.
5. Adjust the location of the axes. To move the existing axes without
resizing or rescaling them, click in and drag an empty region of the
screen until the axes are in the desired location.
6. Change the axes’ scales by pressing
b > Window/Zoom > Window
Settings
(b41).
Type the values of your choice over the current values for x-min,
x-max, y-min, y-max, Xscale, and Yscale and click
OK.
7. Press b > View > Hide Axes (b21) to hide or show the axes.
• If the axes are shown on the page, selecting this tool hides them.
• If the axes are hidden on the page, selecting this tool redisplays
them.
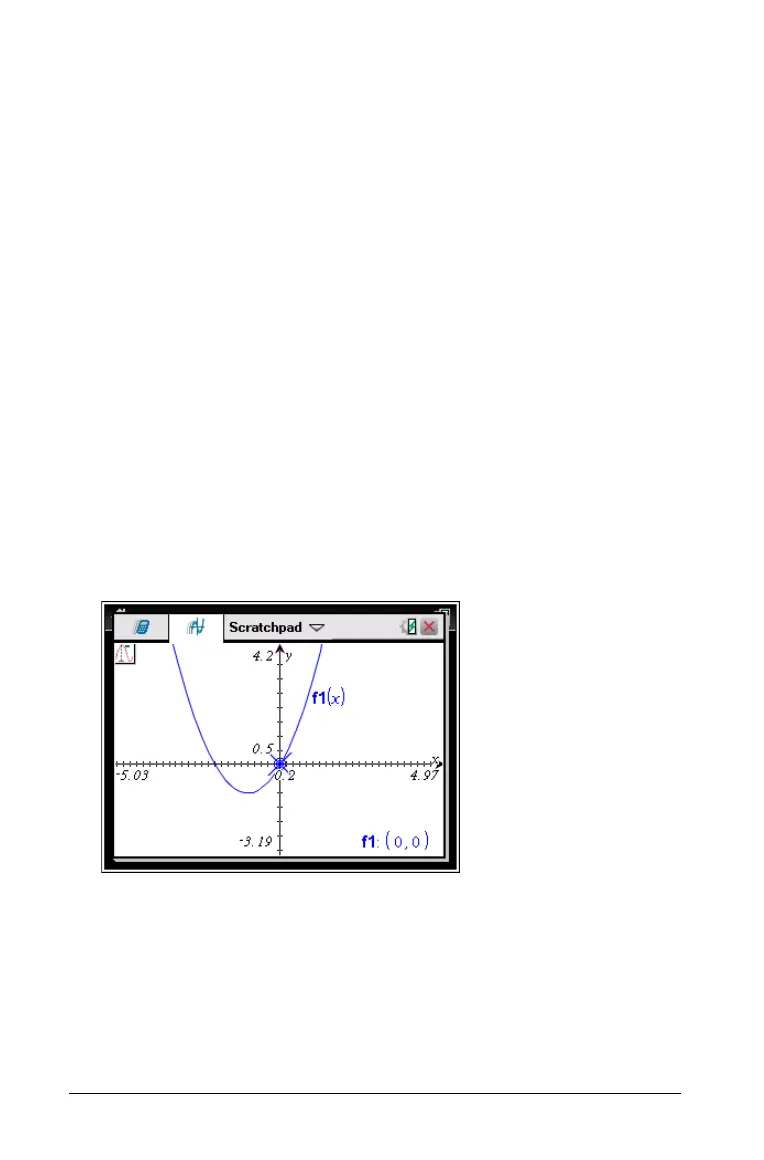
Tracing a Plot
Graph Trace moves through the points of a graphed function,
parametric, polar, sequence, or scatter plot. To enable the trace tool:
1. Press
b > Trace > Graph Trace (b51) to move across the
plot in Trace mode.
2. (Optional) To change the trace step increment for tracing, press
b53.
After you type a different step increment, the Graph Trace tool moves
across the graph in steps of that size.
3. Use Graph Trace to explore a plot in the following ways:
• Move to a point and hover to move the trace cursor to that point.

 Loading...


