20
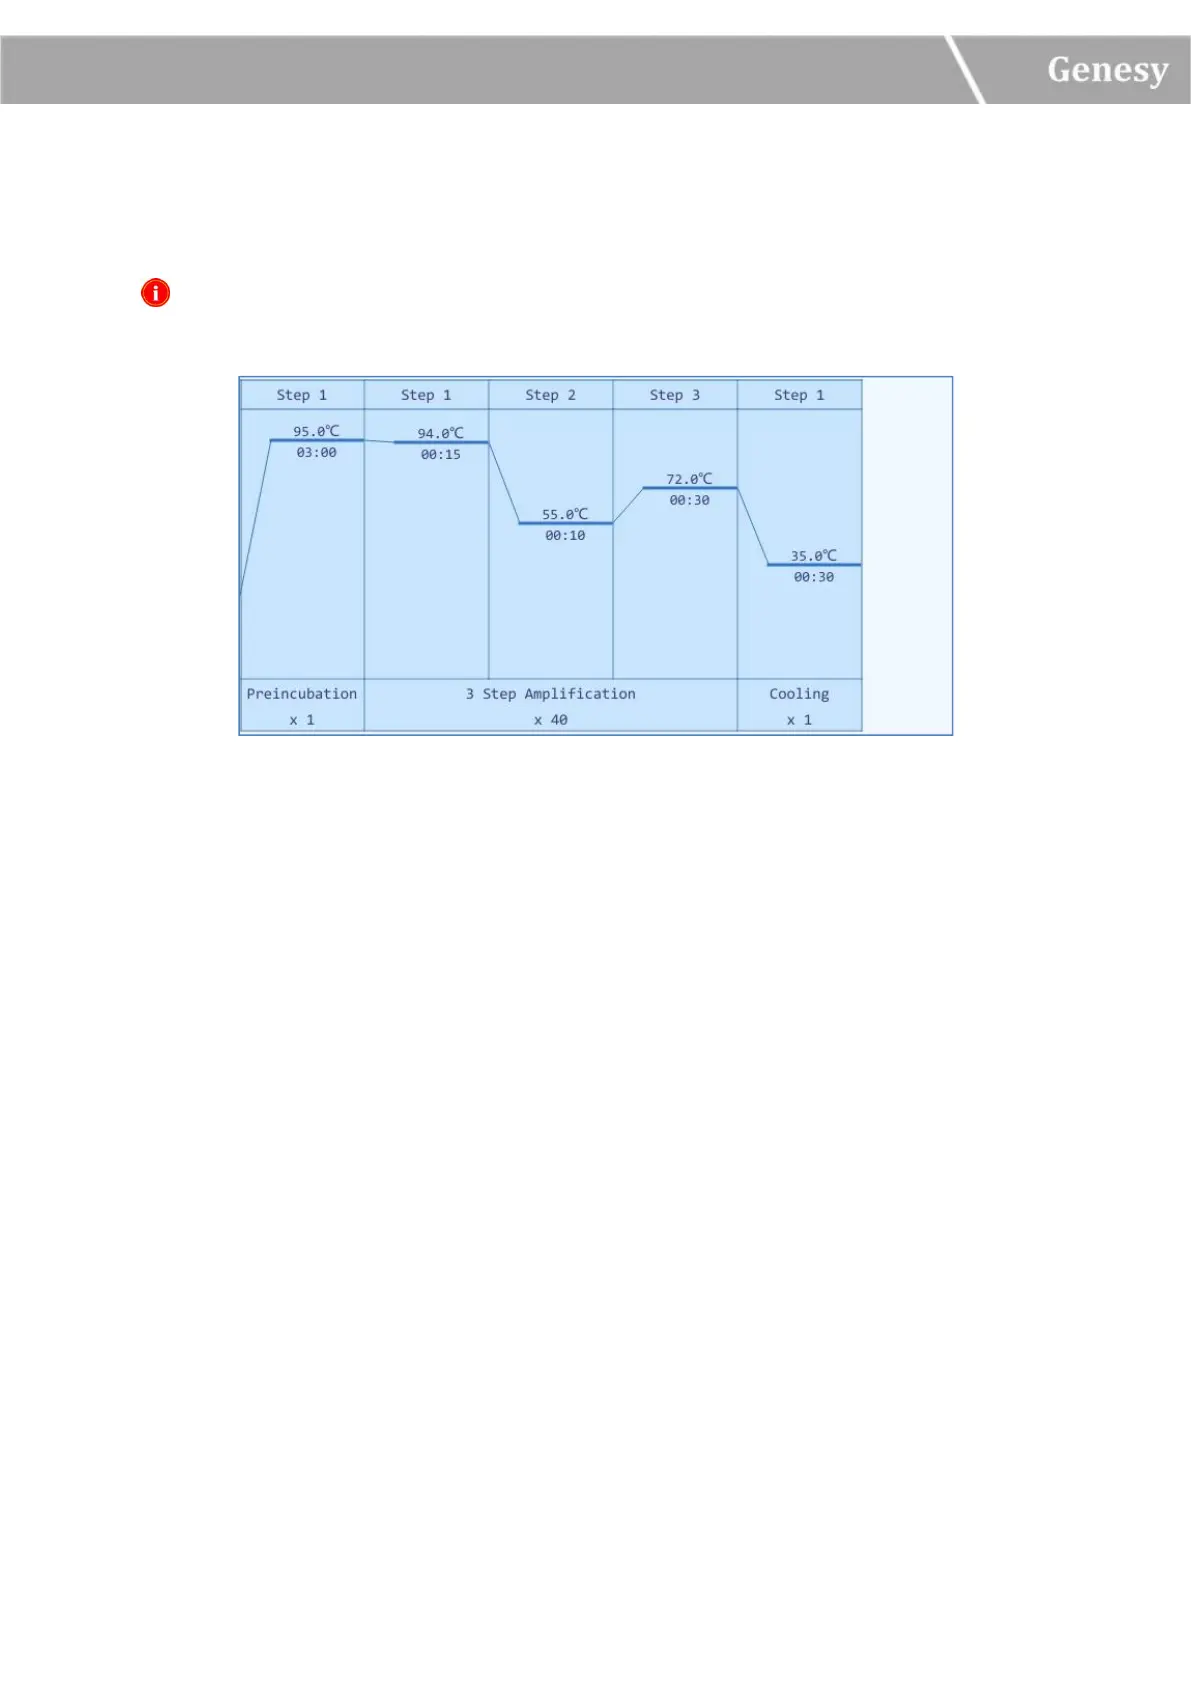
2) Run Monitoring Diagram: display the temperature program of the current running
experiment, as shown in figure 3-4-2.
Reminding: if users choose to use the hot lid heating function, the remaining time will start
to count down after the hot lid reaches the defined temperature.
Figure 3-4-2 Run Monitoring Interface - Run Monitoring Diagram
3.2.4 General Setting
The general setting interface is consisted of Instrument, Configuration and Service three
sub-tabs, as shown in figure 3-4-3.