The "Analyse" menu consists of "Print", "Auto", "Adjust" and "Zoom" four sub items.
- Print: Print out current spectral charts.
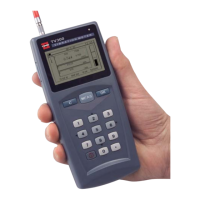
- Auto:
Peak values of the spectral chart could be automatically captured. And different
peak values could be selected by Left/Right keys. (see Figure 5-4)
Figure 5-4 A B
Figure (a) shows the peak-peak value tested is 62.6Hz, that maybe the rev of the
tested object;
Figure (b) shows the peak value tested is 109.6Hz, that maybe the inherent
frequency of the tested object;
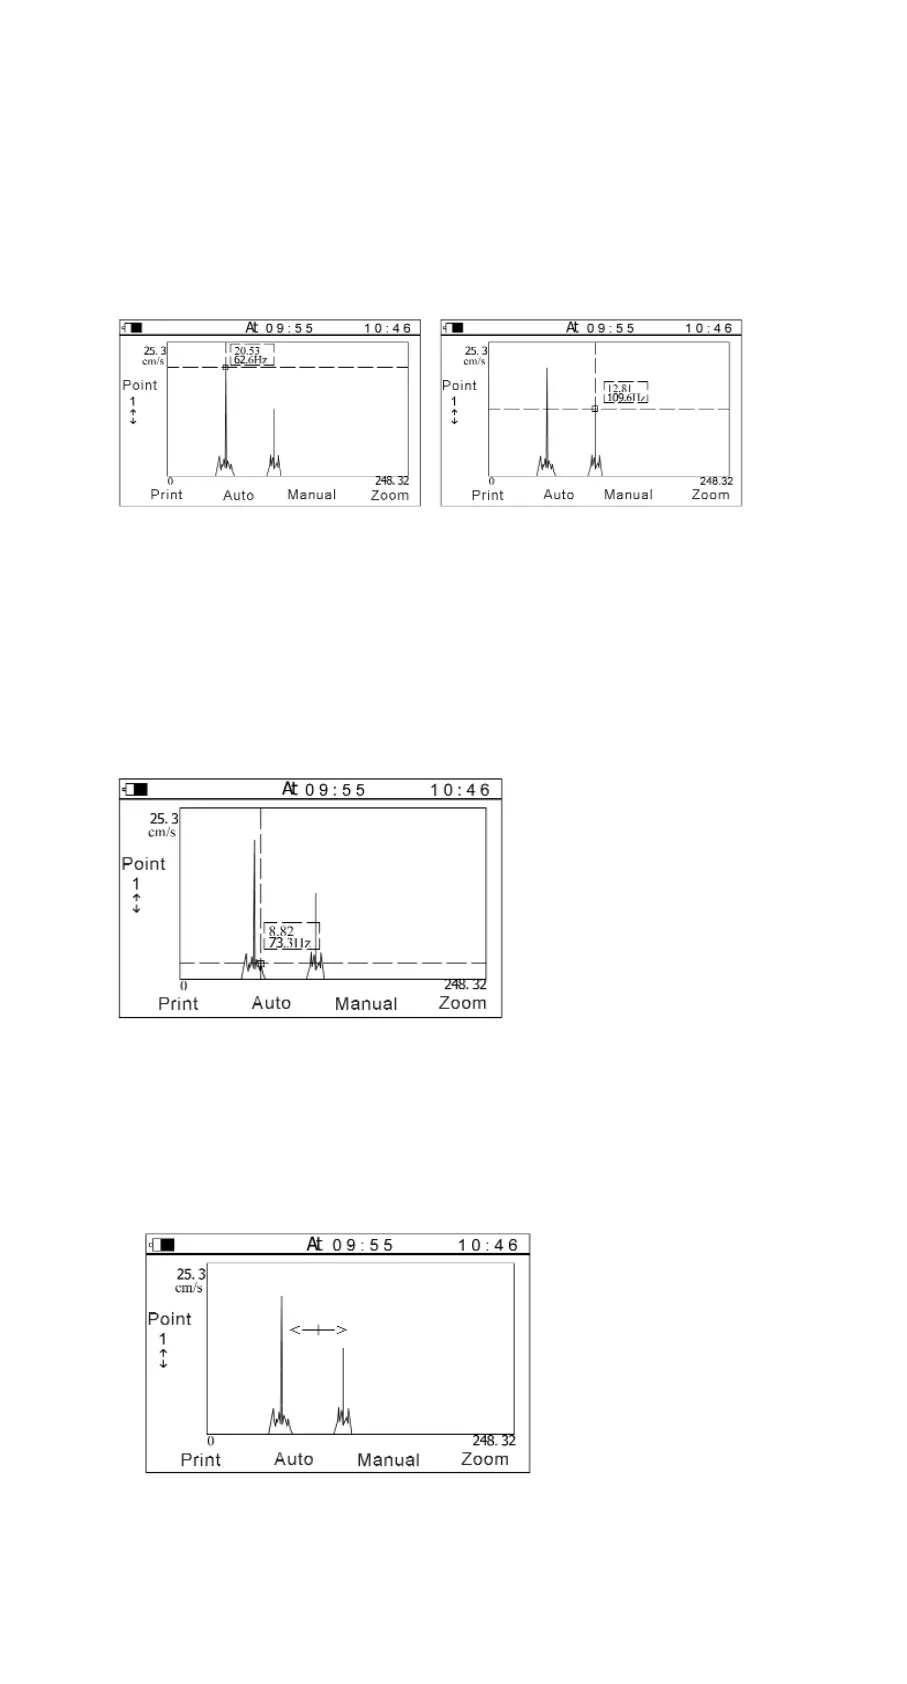
- Manual
The values of different points in the charts can be looked through in the manual
style. The cursor position can be adjusted by Left/Right keys. The amplitude and
frequency of the point, which the cursor indicates, can be displayed.
(see Figure 5-5).
Figure 5-5
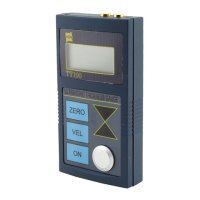
- Zoom
In spectrum analysis, the spectrum zoom function can change the frequency
resolution in the range selected by users. Firstly, to select the range of the
frequency----that is the concerned area, press Left/Right keys to move the
cursor. The cursor could move more quickly when the Left or Right key is hold.
Secondly, Up/Down keys could change the frequency resolution. The resolution
could reach 0.25Hz.
Figure 5-6
12 Manual TV-300