20 RAU-SVX01F-E4
0.2 -65.0 -72.5 2.7 -14.4 -20.9 6.0 7.8 1.7 27.0 62.8 58.8
0.3 -58.7 -66.1 2.8 -13.4 -20.0 6.5 10.2 4.2 28.0 64.4 60.5
0.4 -54.0 -61.3 2.9 -12.5 -19.1 7.0 12.6 6.6 29.0 65.9 62.1
0.5 -50.1 -57.3 3.0 -11.7 -18.2 7.5 14.8 8.9 30.0 67.4 63.7
0.6 -46.8 -54.0 3.1 -10.8 -17.3 8.0 16.8 11.0 31.0 68.8 65.3
0.7 -43.9 -51.0 3.2 -10.0 -16.5 8.5 18.8 13.0 32.0 70.2 66.8
0.8 -41.3 -48.4 3.3 -9.2 -15.6 9.0 20.7 15.0 33.0 71.6 68.3
0.9 -39.0 -46.1 3.4 -8.4 -14.8 9.5 22.6 16.9 34.0 72.9 69.7
1.0 -36.9 -43.9 3.5 -7.6 -14.0 10.0 24.3 18.7 35.0 74.2 71.1
1.1 -34.9 -41.9 3.6 -6.8 -13.3 11.0 27.6 22.1 36.0 75.5 72.5
1.2 -33.1 -40.0 3.7 -6.1 -12.5 12.0 30.7 25.3 37.0 76.7 73.9
1.3 -31.4 -38.3 3.8 -5.4 -11.8 13.0 33.6 28.3 38.0 77.9 75.2
1.4 -29.8 -36.7 3.9 -4.7 -11.0 14.0 36.4 31.1 39.0 79.1 76.5
1.5 -28.3 -35.1 4.0 -4.0 -10.3 15.0 39.0 33.8 40.0 80.2 77.8
1.6 -26.8 -33.7 4.1 -3.3 -9.6 16.0 41.4 36.4 41.0 81.3 79.1
1.7 -25.5 -32.3 4.2 -2.6 -8.9 17.0 43.8 38.8 42.0 82.4 80.3
1.8 -24.1 -30.9 4.3 -2.0 -8.3 18.0 46.0 41.2 43.0 83.4 81.5
1.9 -22.9 -29.6 4.4 -1.3 -7.6 19.0 48.2 43.4 44.0 84.3 82.7
2.0 -21.7 -28.4 4.5 -0.7 -7.0 20.0 50.2 45.6 45.0 85.2 83.9
2.1 -20.5 -27.2 4.6 0.0 -6.3 21.0 52.2 47.7 46.0 86.2 85.1
2.2 -19.4 -26.1 4.7 0.6 -5.7 22.0 54.2 49.7 47.0 87.1 86.2
2.3 -18.3 -25.0 4.8 1.2 -5.1 23.0 56.0 51.6 48.0 88.1 87.3
2.4 -17.3 -23.9 4.9 1.8 -4.5 24.0 57.8 53.5 49.0 89.1 88.4
2.5 -16.3 -22.9 5.0 2.4 -3.9 25.0 59.5 55.3 50.0 90.0 89.5
2.6 -15.3 -21.9 5.5 5.2 -1.0 26.0 61.2 57.1
Table 5- Dew point and Bubble temperature versus pressure for R407C
Absolute
Pressure
(bar)
Dew
Temp.
(°C)
Bubble
Temp.
(°C)
Absolute
Pressure
(bar)
Dew
Temp.
(°C)
Bubble
Temp.
(°C)
Absolute
Pressure
(bar)
Dew
Temp.
(°C)
Bubble
Temp.
(°C)
Absolute
Pressure
(bar)
Dew
Temp.
(°C)
Bubble
Temp.
(°C)
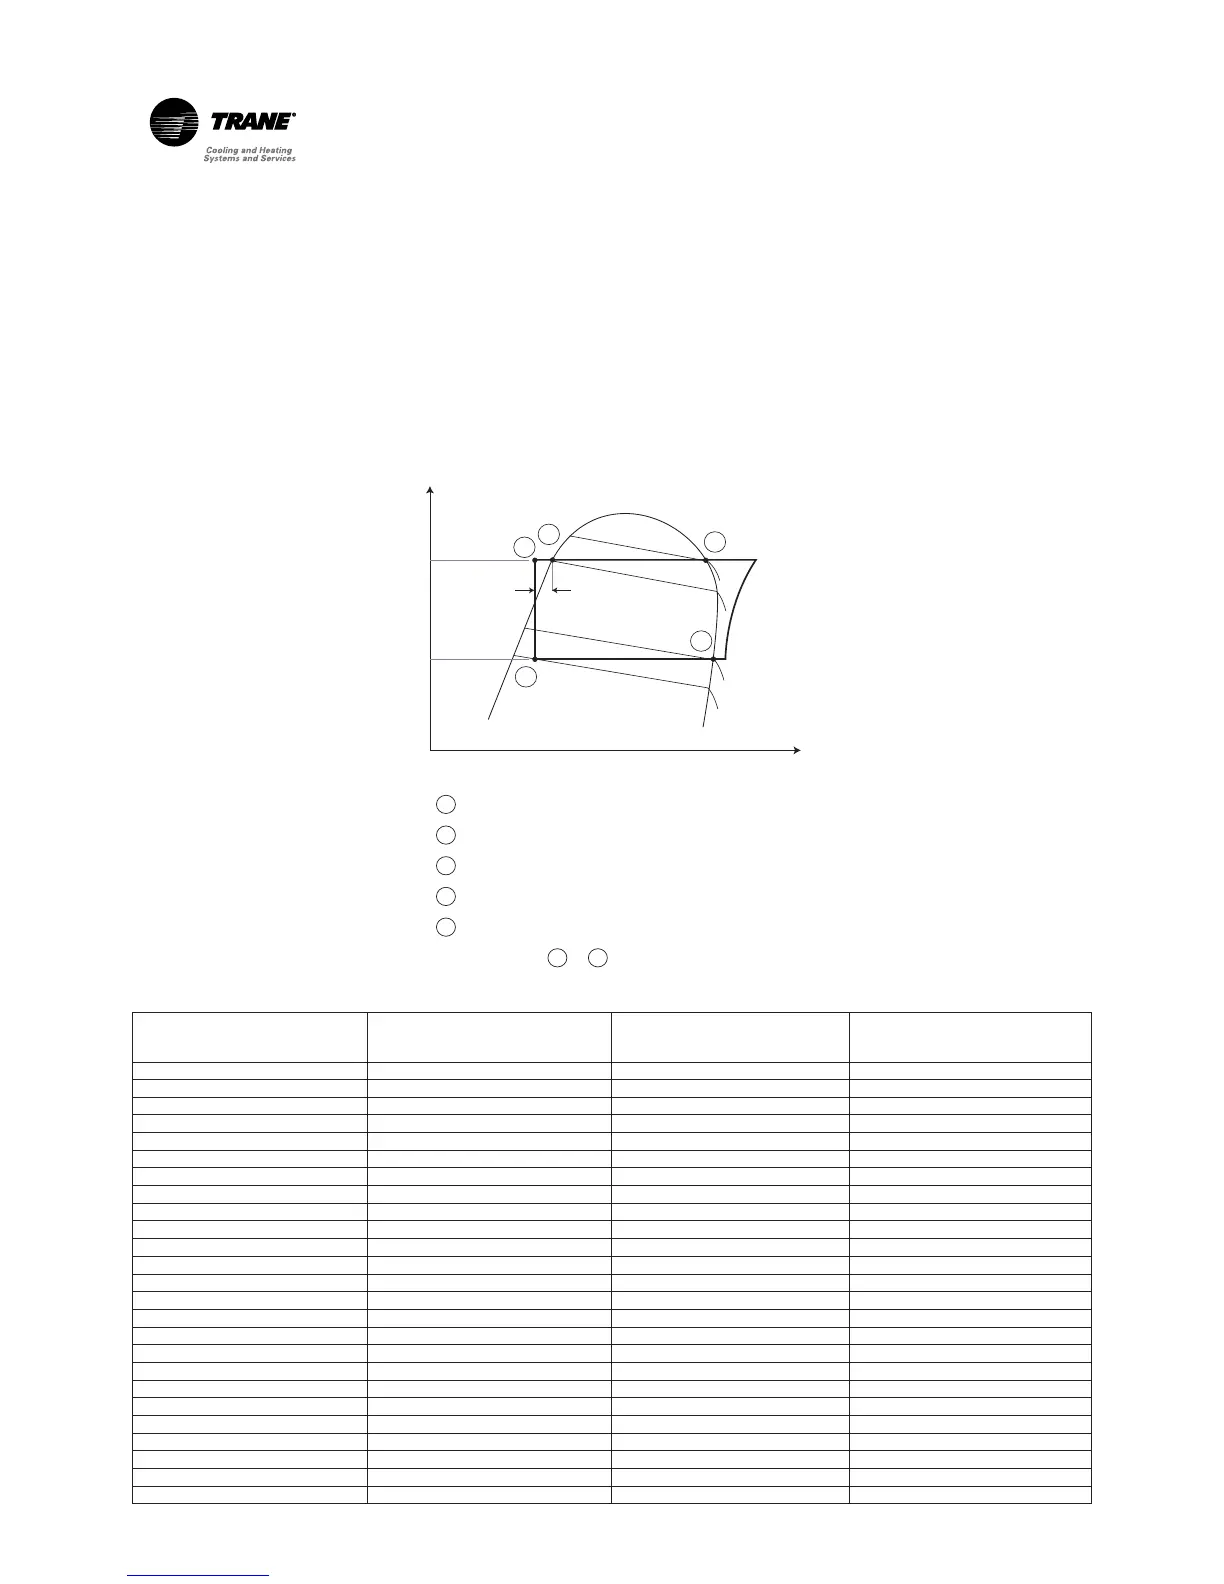
Dew Temperature at Evaporating Pressure
Dew Temperature at Condensing Pressure
Bubble Temperature at Condensing Pressure
Liquid Temperature at Condensing Pressure
Inlet Temperature at Evaporating Pressure
Subcooling = -