INSTALLATION AND OPERATION GUIDE
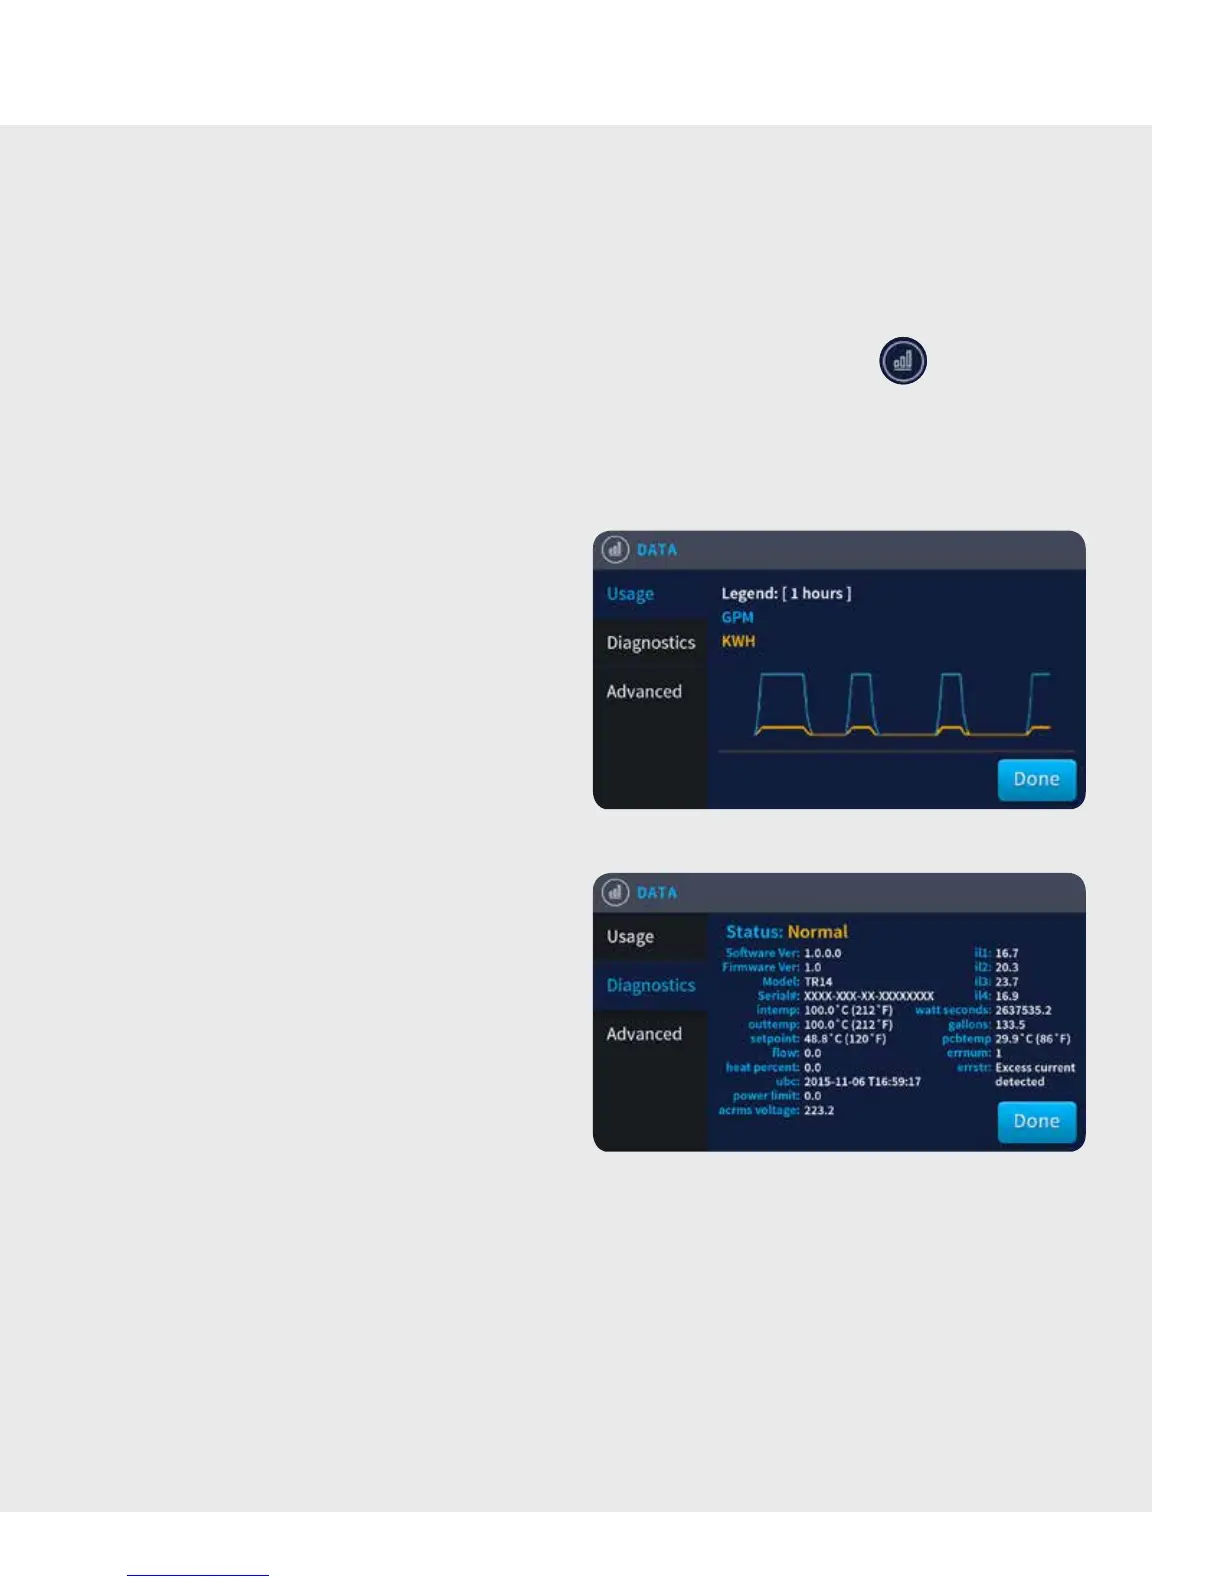
USAGE
The Usage window broadcasts the Trend Graph, which
displays useful history of water flow (GPM) and kilowatt
hours (kWh) over the previous 24 hours.
Complete reporting of history can be obtained via the
Bollente Monitoring Service.
DIAGNOTICS
The Diagnostics Screen report real time data to the
homeowner or service professional. The following
conditions are normally displayed:
Intemp:
Outtemp:
Setpoint:
Flow:
Heatpercent:
Powerlimit:
Acrmsvoltage:
iL1 — iL4:
wattseconds:
gallons:
errnum:
errstr:
Incoming Water Temperature
Outgoing Water Temperature
Desired Temperature Set point (as
defined by the Temperature Controller on
the Home Screen)
Water Flow (GPM)
Amount of available power being applied
to the heating elements
Power is limited to this percentage
at this time
Incoming AC Voltage to the unit
Sensed current (AMPS) on each
of the elements
Totalizer of the number of watts used per
second since installation
Totalizer of the number of gallons
used since installation
Error code
Highest priority alert with reference to
error code (if any exist)
DATA SCREEN
The Data screen provides the trutankless unit owner with a variety of valuable information regarding the performance of
the unit. It displays trend graphs and real-time values for easy monitoring and diagnosis of the unit’s operating condition,
as well as water use statistics.
From the Home screen, tap the Graph icon in the Right Navigation Bar to access the Data screen.
By default, the Usage window is visible at the top level.
NOTE: Real-time information is updated every 60 seconds.
9