69
Operating Curves, Low Voltage Option – (Anode Voltage, Current and
Input Flow)
The Mark II source’s low voltage option is configured for reliable oper-
ation at reduced working anode potentials. This option may be better
suited to delicate processes whose substrate surfaces are highly sensitive
to ion energies at or just above their sputtering threshold. In addition to
lower voltage operation, this option also works at gas flows notably less
than the original design. Given its reduced input gas flow, the output
beam current for the low voltage source option is less than the original
design at the same input power settings.
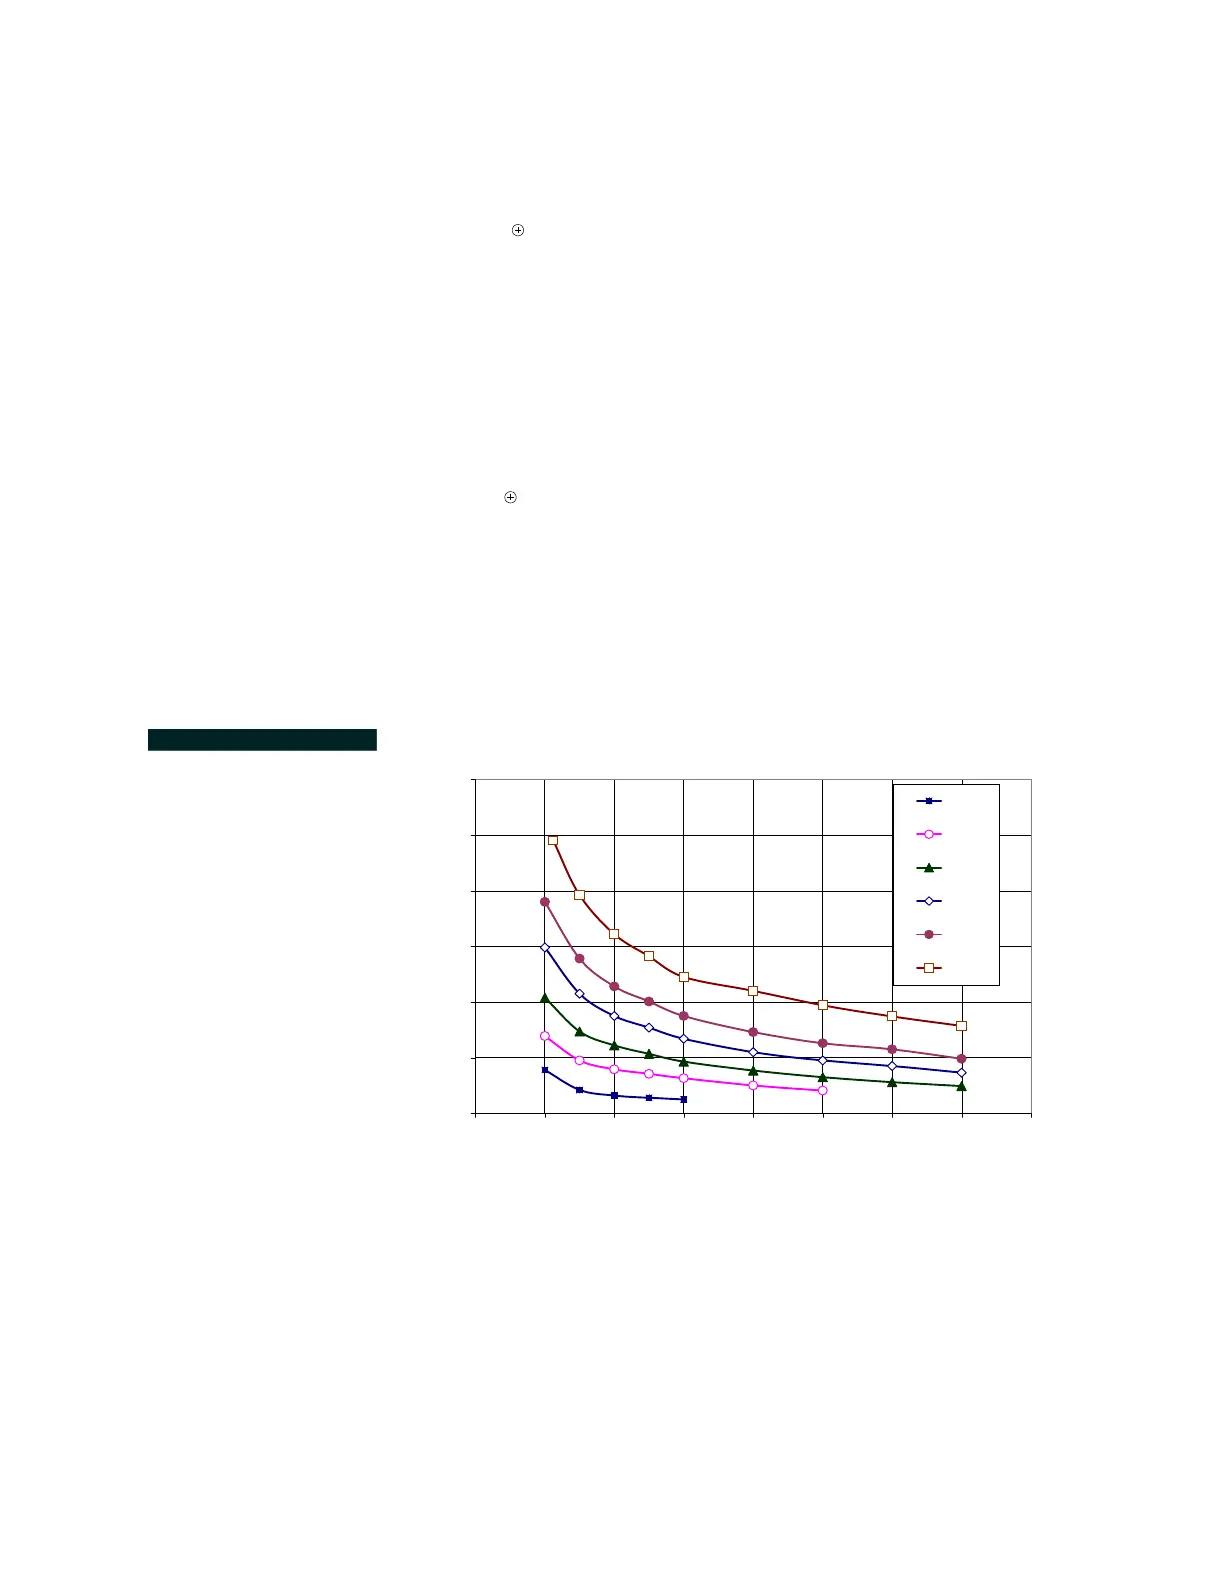
FIGURE B.7 and ”FIGURE B.8” on page 70 provide operating curves for
the Mark II source’s low voltage option for argon and oxygen. These
curves may be used to anticipate the typical input gas flows when
attempting to power the ion source at specific input anode voltage, V
A
,
and anode current I
A
settings.
Typical variance associated with the input flow responses are ±1sccm
which increases by about +2sccm as the ion source reaches thermal steady
state conditions.
FIGURE B.7 Input Gas Flow
vs. Anode Potential (V
A
) and
Anode Current (I
A
) - Low
Voltage Option (Argon).
Operation Characteristics in Argon
(Low Voltage Option)
0
10
20
30
40
50
60
25 50 75 100 125 150 175 200 225
Anode Potential (V)
Source Input Gas Flow - Argon (sccm)
1 A
3 A
5 A
7.5 A
10 A
15 A