30
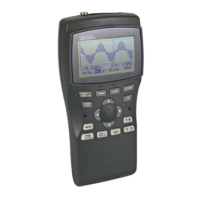
HPS10 PersonalScope
TM
Fig 22
2. Maximum voltage (Vmax.).
The signal's positive peak voltage (difference
between zero and highest value) is displayed.
3. Minimum voltage (Vmin.).
The signal's negative peak voltage (difference
between zero and lowes value) is displayed.
4. Peak to peak (Vpp).
The signal's peak-to-peak voltage (difference
between highest and lowest value) is displayed.
5. True RMS readout (Vrms ac)
The area of the AC wave is calculated and
converted to voltage.
6. dBV measurement (dBV ac).
The measured signal (ac only) is converted to dBv
(0dB= 1V).
7. dBm measurement (dBm ac).
The measured signal (ac only) is converted to
dBm (0dB= 0.775V).
8. dB measurement (dB ac).
The measured signal (ac only) is converted to dB
(0dB= Bref*)
9. True RMS readout (Vrms ac+dc)
The area of the wave (+dc) is calculated and
converted to voltage.
10. dBV measurement (dBV ac+dc).
The measured signal (ac+dc) is converted to dBv
(0dB= 1V).
11. dBm measurement (dBm ac+dc).
The measured signal (ac + dc) is converted to
dBm (0dB= 0.775V).
12. dB measurement (dB ac+dc).
The measured signal (ac+dc) is converted to
dB (0dB=dBref*)
2
3
4
5 9 10 6
8 7 12 11
1
Meter Readout
HPS10_man.pub
page 30
Wednesday, April 03, 2002 09:22
Composite