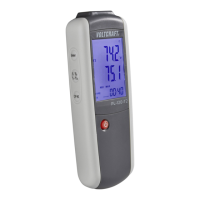
g) Bar graph
• The bar graph can be used to graphically display the current measured value in relation to
the MIN/MAX values. The left end represents the MIN value of the current measurement, the
right end the MAX value.
• Example: The MIN value is 0 °C and the MAX value +100 °C. The current measurement is
+50°C.Inthiscasethebargraphdeectstothemiddleofthedisplay.
11. Settings
a) Emission level
The measuring device allows setting the emission ratio. Thus, different materials and surfaces
can be measured with exact results.
• Hold the MODE button for approx. 1 second to access the setup menu. The symbol for the
emissionlevelashes.
• Press the ▲ or ▼ button to change the value. Press and hold the button for fast setting.
• PressthemeasuringbuttontoconrmyourinputorpresstheMODE button to proceed to
the next setting.
• When the device is switched off, the set value is retained.
Following the technical data you will nd a table with typical materials and their
emission level.
b) Temperature unit
• Hold the MODE button for approx. 1 second to access the setup menu.
• Press the MODEuntilmeasuringunitashesonthedisplay.
• Use▲and▼toselectthedesiredmeasuringunit.
• PressthemeasuringbuttontoconrmyourinputorpresstheMODE button to proceed to
the next setting.
• When the device is switched off, the set value is retained.
32
 Loading...