VSC Software Overview
VESDA Student Workbook 5-13
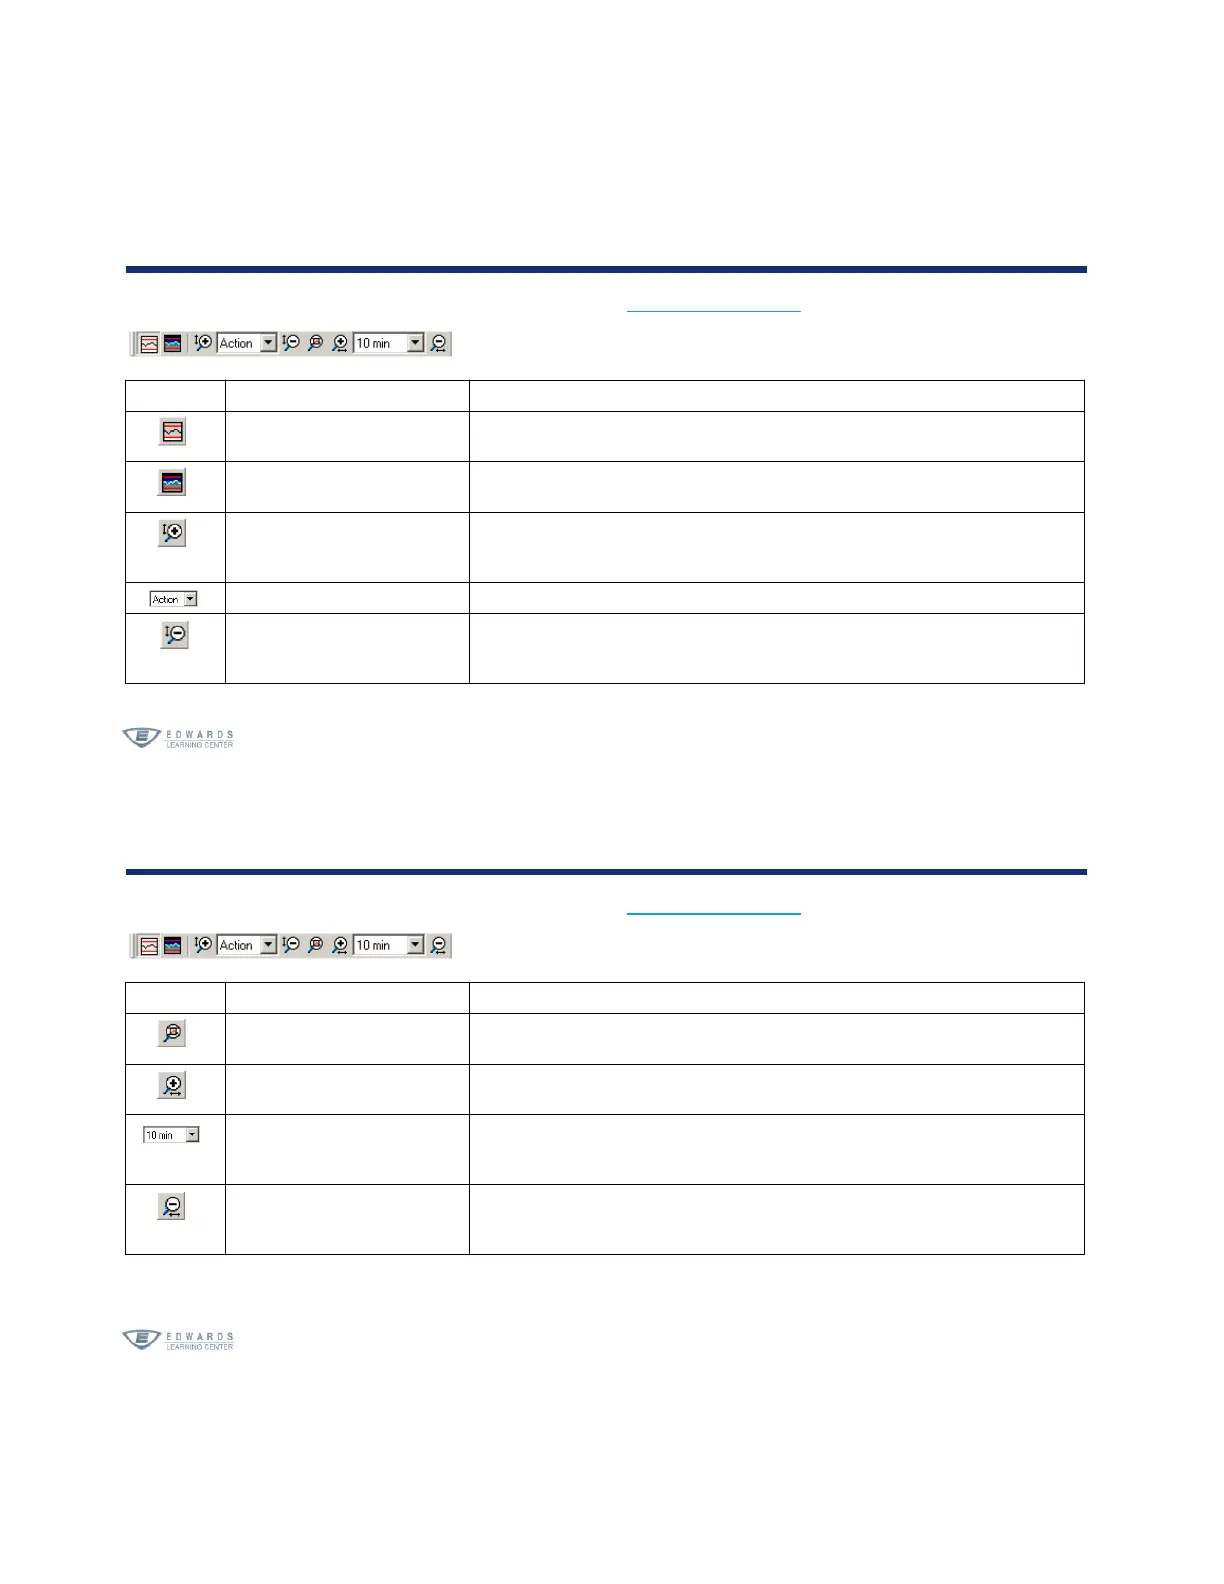
Trend Graph Toolbar
The Trend Graph toolbar is only displayed when the Trend Graph View is selected.
Displays the day threshold levels on the graph.
Displays the night threshold levels on the graph.
Decreases the range of values on the Y axis (Obscuration).
This means you will see more detail.
A list of possible ranges for the Y axis (Obscuration)
Increases the range of values on the Y axis (Obscuration).
This means you will see less detail.
Trend Graph Toolbar
The Trend Graph toolbar is only displayed when the Trend Graph View is selected.
Displays all obscuration and time values in the graph.
Decreases the range of values on the X axis (Time).
This means you will see more detail.
A list of possible ranges for the X axis (Time).
Increases the range of values on the X axis (Time).
This means you will see less detail.