Do you have a question about the Yamaha P2100 and is the answer not in the manual?
Defines the P2100 as a system-oriented amplifier and the manual's scope.
Recommends reading the manual and outlines its sections and their content.
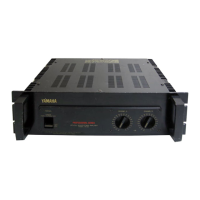
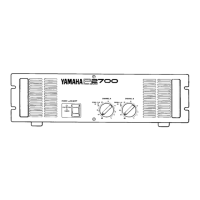
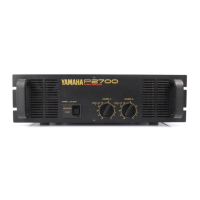
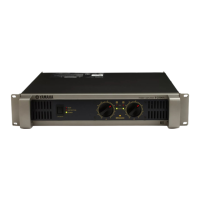
Identifies front panel components: Thermal Warning Indicator, Power Indicator, Input Attenuators, Power Switch.
Provides rack-mounting dimensions and recommendations for portable racks.
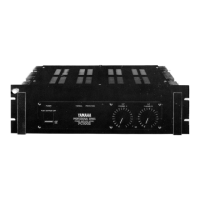
Identifies rear panel connectors: Input Connectors, Input Polarity Switch, Output Connectors, AC Power Cord, Fuse.
Details input impedance, paralleling inputs, and transformer placement.
Covers AC power requirements and fuse details for different regions.
Introduces the P2100 as an advanced, high-accuracy sound amplifier.
Explains the log-linear, 22-step dB-calibrated input attenuators.
Details XLR and phone jack inputs, polarity switch, and binding post outputs.
Describes converting the P2100 to a 'super amplifier' for mono use.
Highlights P2100's performance: low distortion, high damping factor, wide frequency response.
Discusses rugged construction, heat sinks, and protection circuits.
Lists detailed specifications for power output and total harmonic distortion.
Details frequency response limits and required input levels for rated output.
Explains damping factor, rise time, and slew rate specifications.
Provides specifications for hum, noise ratio, and channel separation.
Lists power requirements and refers to protection circuit discussions.
Details physical dimensions, weight, and front panel indicators.
Lists power output and clipping specifications for mono operation.
Details distortion and frequency response for mono mode.
Specifies input sensitivity and impedance for mono operation.
Provides damping factor and slew rate for mono mode.
Graph showing power bandwidth relative to load impedance.
Graph illustrating output power at different load impedances.
Graph showing frequency response across various loads.
Graph of Total Harmonic Distortion versus output power at 8 ohms.
Graph of Total Harmonic Distortion versus output power at 16 ohms.
Graph showing Intermodulation Distortion versus output power.
Graph illustrating damping factor across different frequencies.
Graph showing the amplifier's actual output impedance.
Graph demonstrating channel separation performance.
Graph showing phase response across frequencies.
Graphs detailing power consumption, AC input, and efficiency.
Graph showing power bandwidth for mono operation.
Graph of output power versus load impedance in mono mode.
Graph of frequency response for mono operation.
Graph of THD versus power output in mono mode.
Graph of damping factor across frequencies in mono mode.
Graph of actual output impedance in mono mode.
Shows oscilloscope photos of square-wave responses at different frequencies.
Illustrates sine wave response, highlighting low noise and distortion.
Shows square-wave response into a reactive load, demonstrating stability.
Displays the unit-step function response, indicating protection against DC input.
Discusses types of power ratings: peak, RMS, and continuous average sine wave power.
Explains the importance of high power output based on human hearing and transient response.
Defines clipping power output rating at 1kHz with an 8-ohm load.
Describes how power output changes with load impedance and protection circuits.
Explains harmonic distortion, THD, clipping, and crossover distortion.
Discusses intermodulation distortion and dynamic frequency response shift.
Details the P2100's flat frequency response and its intentional low-frequency limitation.
Explains offset voltage and the unit step function response for protection.
Defines power bandwidth and phase response, noting their characteristics.
Discusses channel separation and its effectiveness in stereo programs.
Discusses hum and noise levels, stating they are inaudible.
Explains rise time and slew rate as indicators of amplifier performance.
Discusses the P2100's high input impedance and input sensitivity.
Covers protection circuits, thermal characteristics, and gain definition.
Discusses the P2100's very low output impedance and damping factor.
Illustrates how back EMF current flows through the amplifier's output impedance.
Differentiates professional audio equipment from hi-fi or semi-pro equipment.
Explains impedance differences between pro and hi-fi gear and cable effects.
Illustrates how source impedance and cable capacitance affect signal filtering.
Details nominal and peak operating levels for professional and hi-fi equipment.
Explains dynamic range, noise floor, and its importance in sound systems.
A diagram illustrating dynamic range through a typical audio system chain.
Explains gain overlap and headroom in professional audio systems.
Discusses how input sensitivity ratings differ between devices.
Lists advantages of professional equipment like balanced lines and reliability.
A diagram showing typical gains and losses in an audio system setup.
| Input Sensitivity | 0.775 V |
|---|---|
| Type | Stereo Power Amplifier |
| Damping Factor | 200 |
| Speaker Load Impedance | 4Ω - 16Ω |
| Frequency Response | 10Hz - 50kHz (±0.5dB) |