10-3
IM WT1801-01EN
Difference between Waveform Sampling Data and Waveform Display Data
Waveform sampling data and waveform display data are both measured waveform data, but they differ as
described below.
• W
aveform sampling data: Data derived through A/D conversion of the input signal
The WT1800 A/D conversion rate is approximately 2 MS/s.
Therefore, if the data update interval is set to
1 s, the number of data points sampled from a single input signal in a single measurement is approximately
2,000,000 (see the figure below). Waveform sampling data is also called acquisition data or raw wave data.
• Waveform display data: Waveform data displayed on the WT1800 screen (1602 points)
When the WT1800 displays waveforms, data points (of waveform display data) are displayed in horizontal
rasters (along the time axis). The number of rasters is 801. Each raster contains two points of waveform
display data. The two data points are the maximum and minimum values of the waveform data in each raster.
Therefore, the number of waveform display data points (the number of points displayed on the screen) for a
single input signal is 1602.
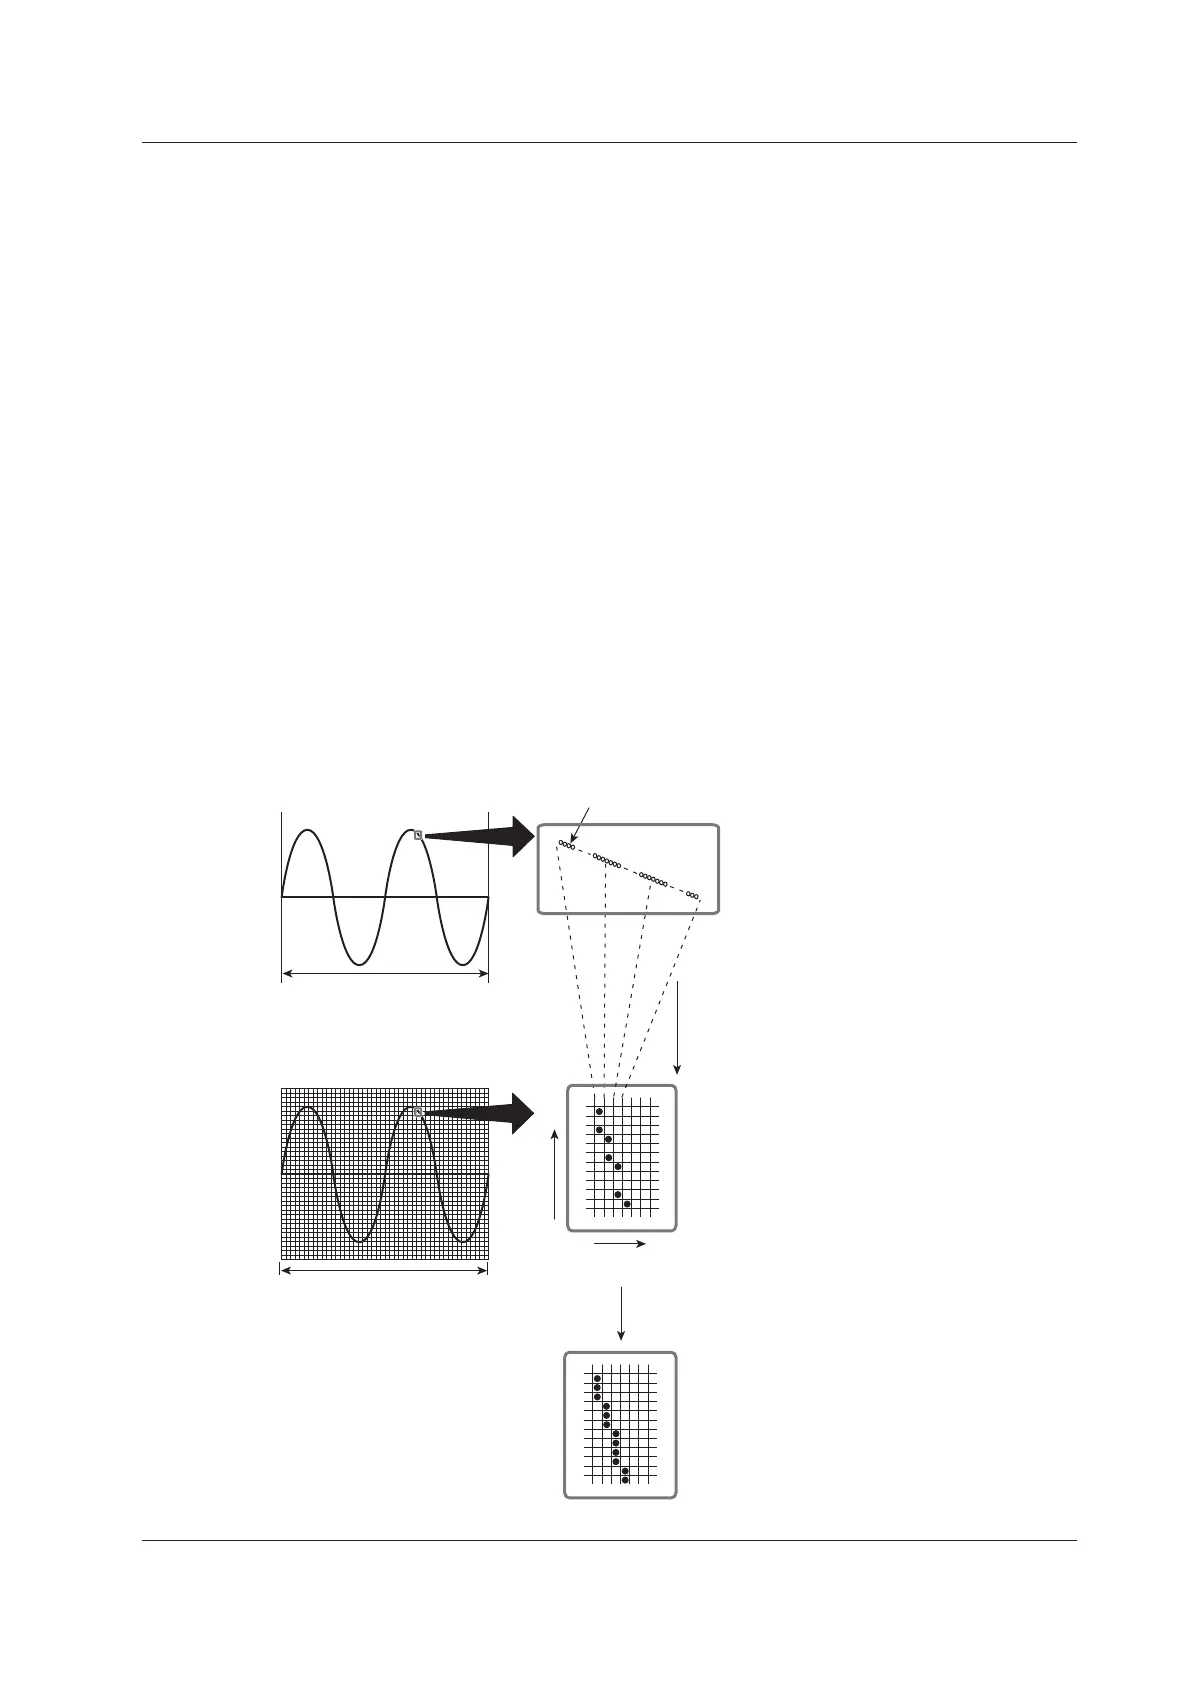
p-p Compression
p-p compression is the compression method used to derive waveform display data from waveform sampling
data. For example, if a 2-Hz sine wave is measured at a data update rate of 1 s, to display this waveform, the
WT1800 converts the number of data points from approximately 2,000,000 to 1602 (801 pairs of maximum
and minimum values). Thus, two points (a pair) of waveform display data are derived from approximately 2500
points of waveform sampling data. This conversion is called p-p (peak-peak) compression. The compression
ratio of p-p compression varies depending on the data update interval and the horizontal scale (time axis) of the
waveform display.
801 rasters
Number of data points: 1,602 (801 pairs)
0 800
Time axis
Waveform sampling data
Waveform display data (WT screen)
p-p compression
Compresses
approximately 2500
points of waveform
sampling data to
2 points (extracts
the maximum and
minimum values
and draws them
in each raster)
A/D-converted data
1 s
Number of data points: Approx. 2,000,000
With display interpolation
on
Vertical axis
10 Waveform Display
 Loading...