ACORN CONTROLS / ACORNCONTROLVALVES.COM / 1.800.488.8999
27
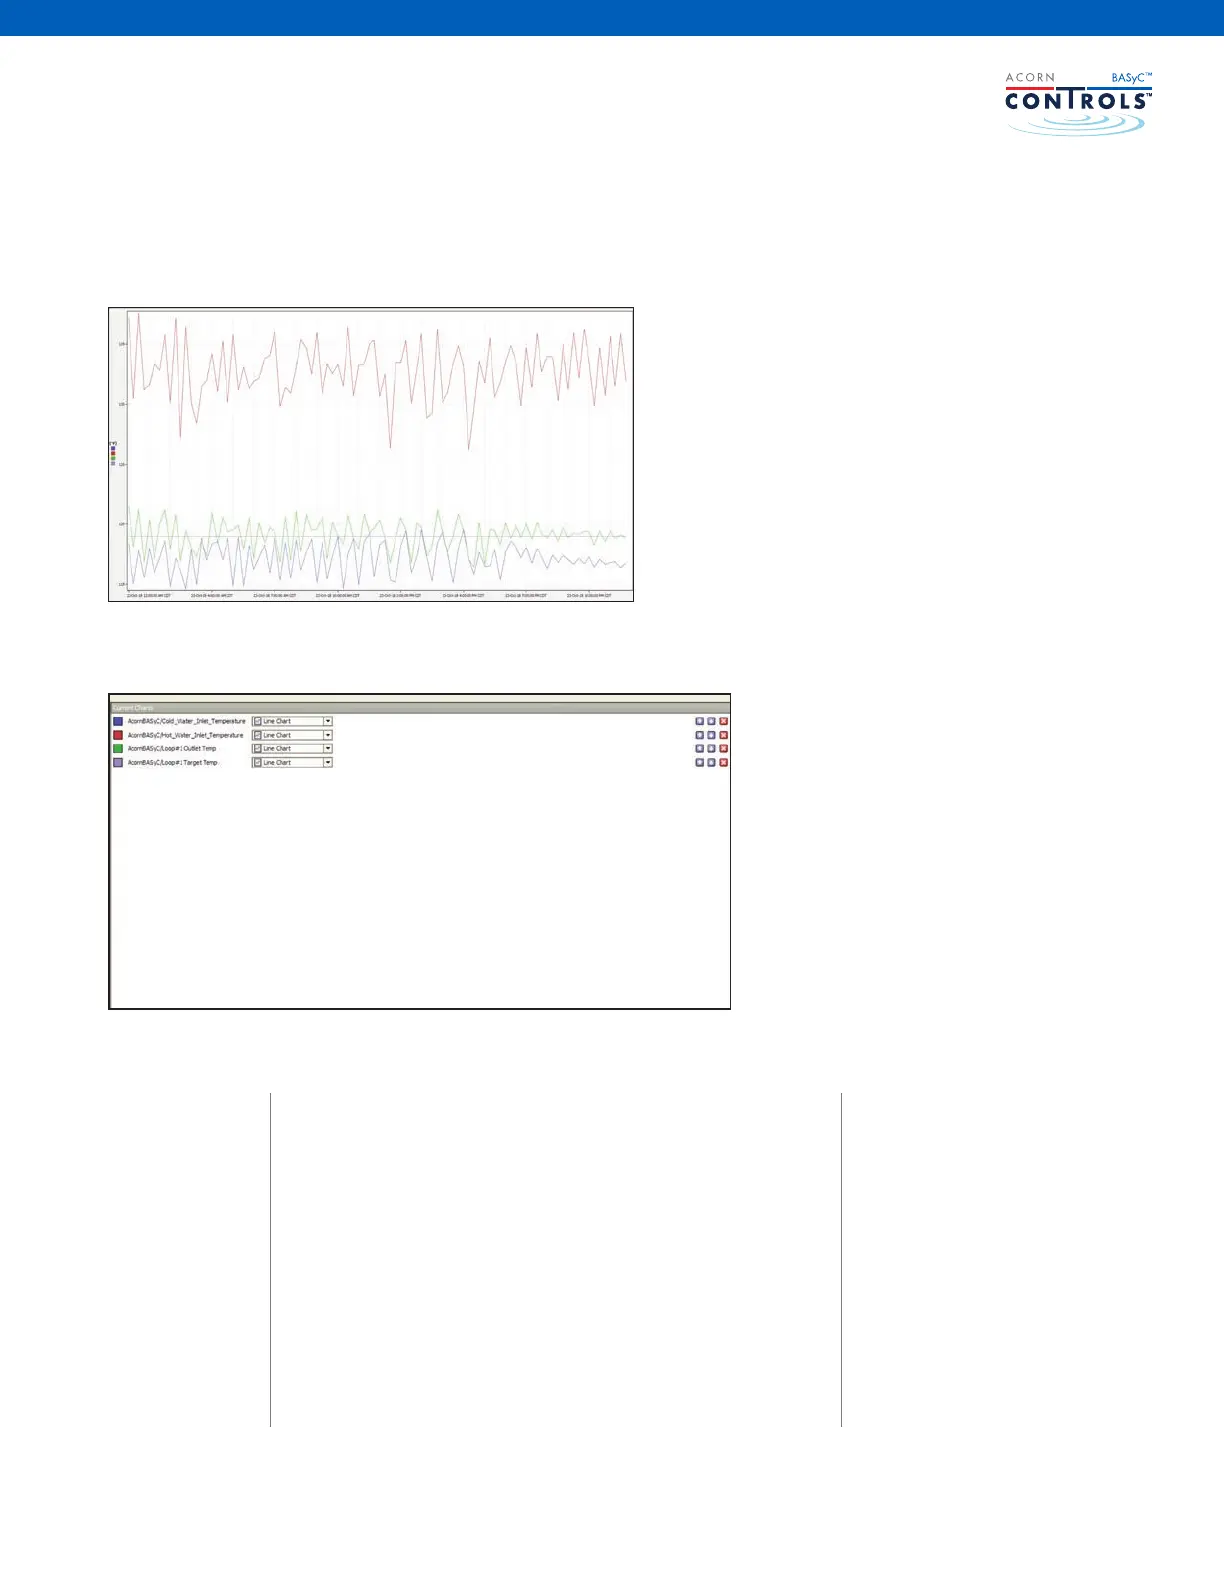
Every BASyC™ system features a very powerful report generating capability available at the “Data Reports
and Chart” screen. Creating customized and detailed charts is easy. An example of a graph is shown below:
User selections to generate this report/graph are as follows:
Note: After you’ve run your report, you
can right click on the screen and choose
to export the data in pdf, text, html or
CSV format, or choose to export the
view in pdf.
Available user selections for are:
Time Range
- Today
- Last 24 hours
- Yesterday
- Week to Date
- Last week
- Last 7 days
- Month to Date
- Last Month
- Year to Date
- Last Year
Title - Give your report any name you chose
Grid Lines - Choose to show or hide gridlines
Rollup - Choose to rollup 1, 5, 15, 30 minutes, 1 hour, 1
day, 1 month or 1 year of data and display the minimum,
maximum, average or the sum of the values for the rol-
lup time period chosen.
Format - After you run your report, you can save it in .px
le format for editing, copy it or export it to a .pdf le.
Report Type -
Choose to display data as:
- line
- area
- bar
- stacked bar
- discrete line
- discrete area
- Pie Chart
DATA REPORTS/CHARTING YOUR DATA
 Loading...