39
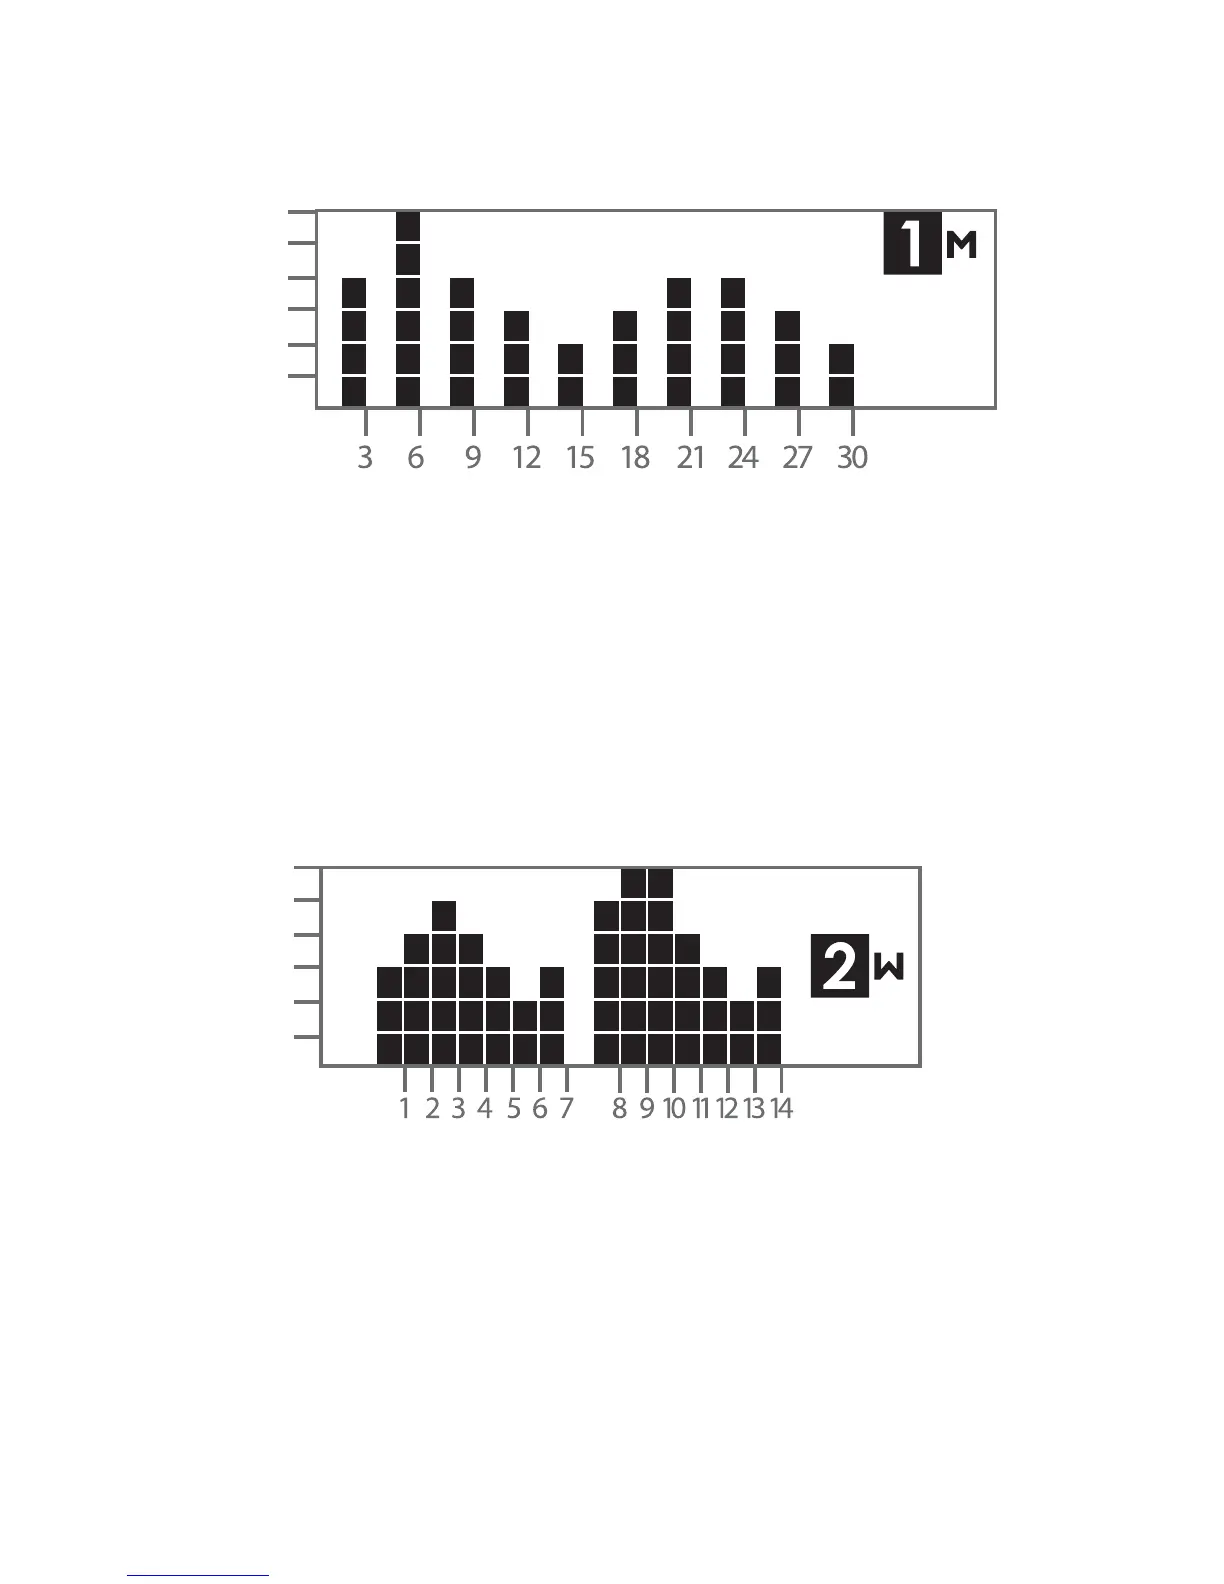
1 Month Trend Graph:
2 Week Trend Graph:
Each bar represents a test result average from 3 days. Each
vertical unit represents about 2.8 mmol/L. The most recent
result is on the right side of the screen.
Each bar represents a test result average from 1 day. Each
vertical unit represents about 2.8 mmol/L. The most recent
result is on the right side of the screen.
Days
mmol/L
16.7
13.9
11.1
8.3
5.6
2.8
Days
mmol/L
16.7
13.9
11.1
8.3
5.6
2.8