40
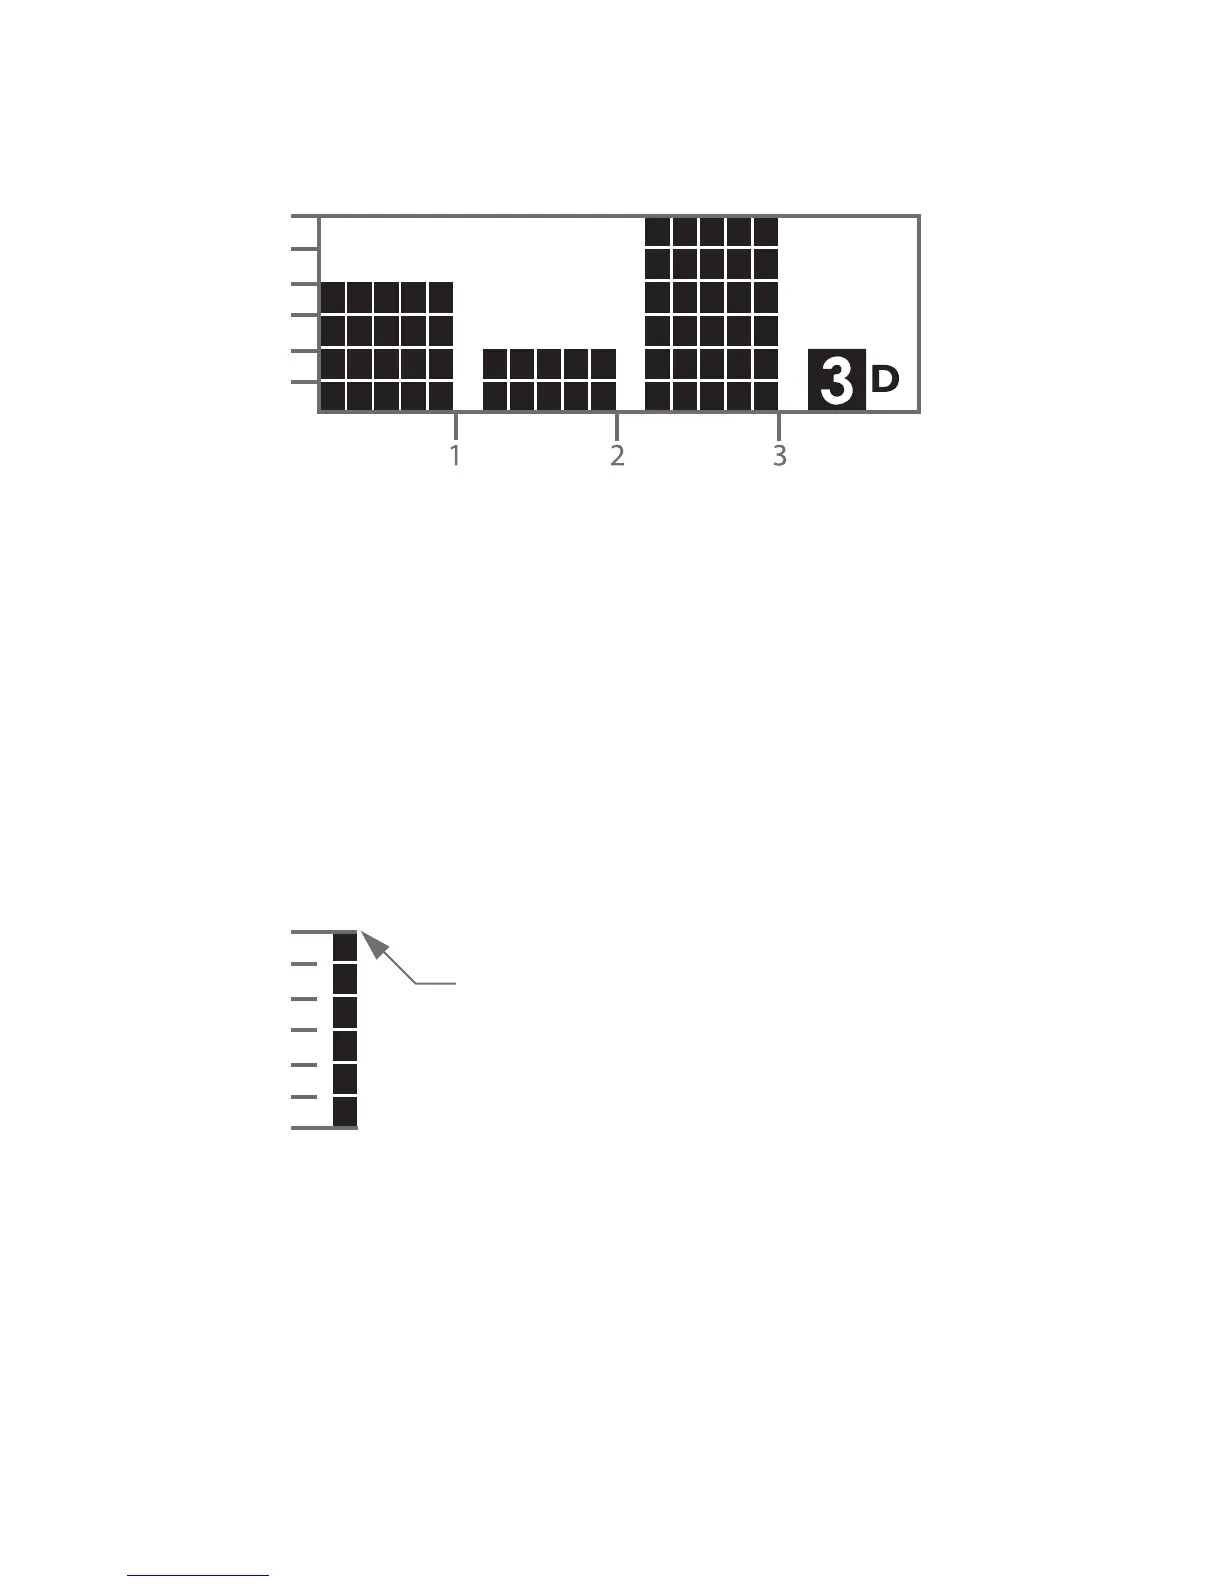
3 Day Trend Graph:
Each bar represents a test result average from 1 day. Each
vertical unit represents about 2.8 mmol/L. The most recent
result is on the right side of the screen.
IMPORTANT: Averages above 16.7 mmol/L will not be
represented in the trend graphs.
Any bars represented at 16.7 mmol/L may
represent a value higher than 16.7 mmol/L.
Days
mmol/L
16.7
13.9
11.1
8.3
5.6
2.8
mmol/L
16.7
13.9
11.1
8.3
5.6
2.8
0