EasyManua.ls Logo

Agilent Technologies DSO-X-2024A User Manual

Agilent Technologies DSO-X-2024A
7 pages
To Next Page IconTo Next Page
Page #1 background imageLoading...
Page #1 background image
!1
EE 201 Lab !
!
Agilent DSO-X-2024A digital oscilloscope !
!
In its basic mode of operation, an oscilloscope takes a rapid sequence of voltage measurements
and displays these in the form of a plot showing the voltage as a function of time. Imagine if you
and your lab partner were to take a series of voltage measurements at specified interval, say
every 3 seconds, and then enter your measurements into Excel. You could generate a plot of the
voltage as function of time, giving you an “image” of the time-varying waveform. This is what
the oscilloscope does, but significantly faster than you and your lab partner. The voltage
measurements of the oscilloscope may be only 1 ns apart (1 billion measurements every second).
Thus, it provides a detailed view of a waveform from some part of circuit. The oscilloscope
works particularly well with periodic signals, because it can be “triggered” from the periodic
signal and offer a continuous display of the signal. However, when set up properly, the
oscilloscope can also capture aperiodic (or “one-shot”) waveforms. !
!
In some sense, the oscilloscope can be viewed as a “waveform microscope”. Using a biology lab
microscope, we peer through the lenses and then adjust the magnification to get clear images. If
we are trying to look at an amoeba, we would like to set the magnification so the image amoeba
will just fill up the entire field of view of the microscope. If the magnification is too low, the
image of the amoeba is too small to see details. If the magnification is too high, the amoeba
more than fills the field of view and we may miss something interesting. In the same way, we
can adjust the time- and voltage-axis settings of the oscilloscope to get a clear graph of the
waveform. Sometimes we may want to reduce the scale in order to zoom in on some portion of a
waveform. Other times, we may need to increase the scale so that we can see several periods of
the waveform.!
!
The oscilloscope has an Autoscale function, which captures a waveform and then sets up the
display to give a reasonable graph. As you start out with the oscilloscope, you may use this
feature frequently, but as you become more proficient with the “scope”, you should use
Autoscale less and less. Typically, we will use the Autoscale to get the preliminary measurement
and then make adjustments to the settings in order to look more carefully at things of interest.!
!
EE 201 rule of thumb: !
On any particular measurement on circuit, you should use the Autoscale no more than once,
right at the outset in order to get “close”. After that, all adjustments should be made with the
time and voltage settings knob. Excessive use of Autoscale is a clear indication that the user
is a rookie.!
!
The oscilloscopes in Rm 2014 are quad-channel, meaning that they can measure and display four
separate voltage waveforms simultaneously. This is very useful for seeing how a circuit modifies
a signal. For example, we can apply a voltage signal from the function generator to the input of
an amplifier or filter circuit and observe the source voltage with one channel. We can use another
channel to observe the output voltage waveform. If both waveform traces are displayed on the
oscilloscope screen, we can immediately see the amplification or the signal filtering action.!
!
!
!
Question and Answer IconNeed help?

Do you have a question about the Agilent Technologies DSO-X-2024A and is the answer not in the manual?

Agilent Technologies DSO-X-2024A Specifications

General IconGeneral
BrandAgilent Technologies
ModelDSO-X-2024A
CategoryTest Equipment
LanguageEnglish

Summary

Agilent DSO-X-2024A Digital Oscilloscope Introduction

Oscilloscope Basic Operation

Explains how an oscilloscope measures and displays voltage as a function of time for circuit analysis.

Waveform Microscope Analogy

Compares oscilloscope adjustment to using a microscope for clear waveform visualization.

Autoscale Function Usage

Describes the Autoscale feature for automatic waveform acquisition and display setup.

EE 201 Rule of Thumb: Autoscale

Provides a guideline on using Autoscale sparingly to avoid appearing as a novice user.

Quad-Channel Measurement

Explains the benefit of measuring multiple waveforms simultaneously for circuit analysis.

Agilent DSO-X-2024A Front Panel Controls

Power Switch and Channel Inputs

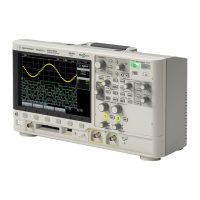
Details the power switch and the four channel input terminals for signal connection.

Vertical and Horizontal Scale Controls

Describes controls for adjusting voltage (vertical) and time (horizontal) scales for waveform display.

Autoscale, Run-Stop, and Single Buttons

Explains the function of the Autoscale, Run-Stop, and Single measurement acquisition buttons.

Softkeys and Entry Knob

Details the context-sensitive softkeys and the multi-function entry knob for settings adjustment.

Measurement and Data Keys

Covers keys for taking measurements, using cursors, and saving waveform data.

USB Port

Identifies the USB port for connecting external storage devices.

Basic Oscilloscope Measurement Steps

Power Up and Connections

Covers powering on the oscilloscope and making physical connections to the circuit under test.

Performing Autoscale and Manual Adjustments

Details the process of using Autoscale and then manually adjusting time/voltage scales for optimal display.

Measurements and Cursors

Explains how to use measurement functions and cursors to analyze waveform data.

Saving Traces

Guides on saving waveform screen captures to a flash drive for documentation.

Oscilloscope Exercise: Voltage Divider

Exercise Setup and Connections

Instructions for setting up the voltage divider circuit and connecting it to the oscilloscope channels.

Acquiring and Adjusting Traces

Steps to use Autoscale and manually adjust time/vertical scales for clear waveform display.

Using Cursors for Analysis

Demonstrates using cursors to measure time differences and voltage levels on traces.

Saving Images and Experimentation

Instructions on saving screen images and further exploration of oscilloscope functions.

Related product manuals