Preliminary Technical
Data
Rev. PrA | Page 36 of 82
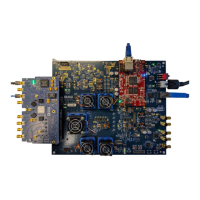
Figure 39. ORx Interference vs Stability Metrics
Transmit Signal vs Stability Metrics
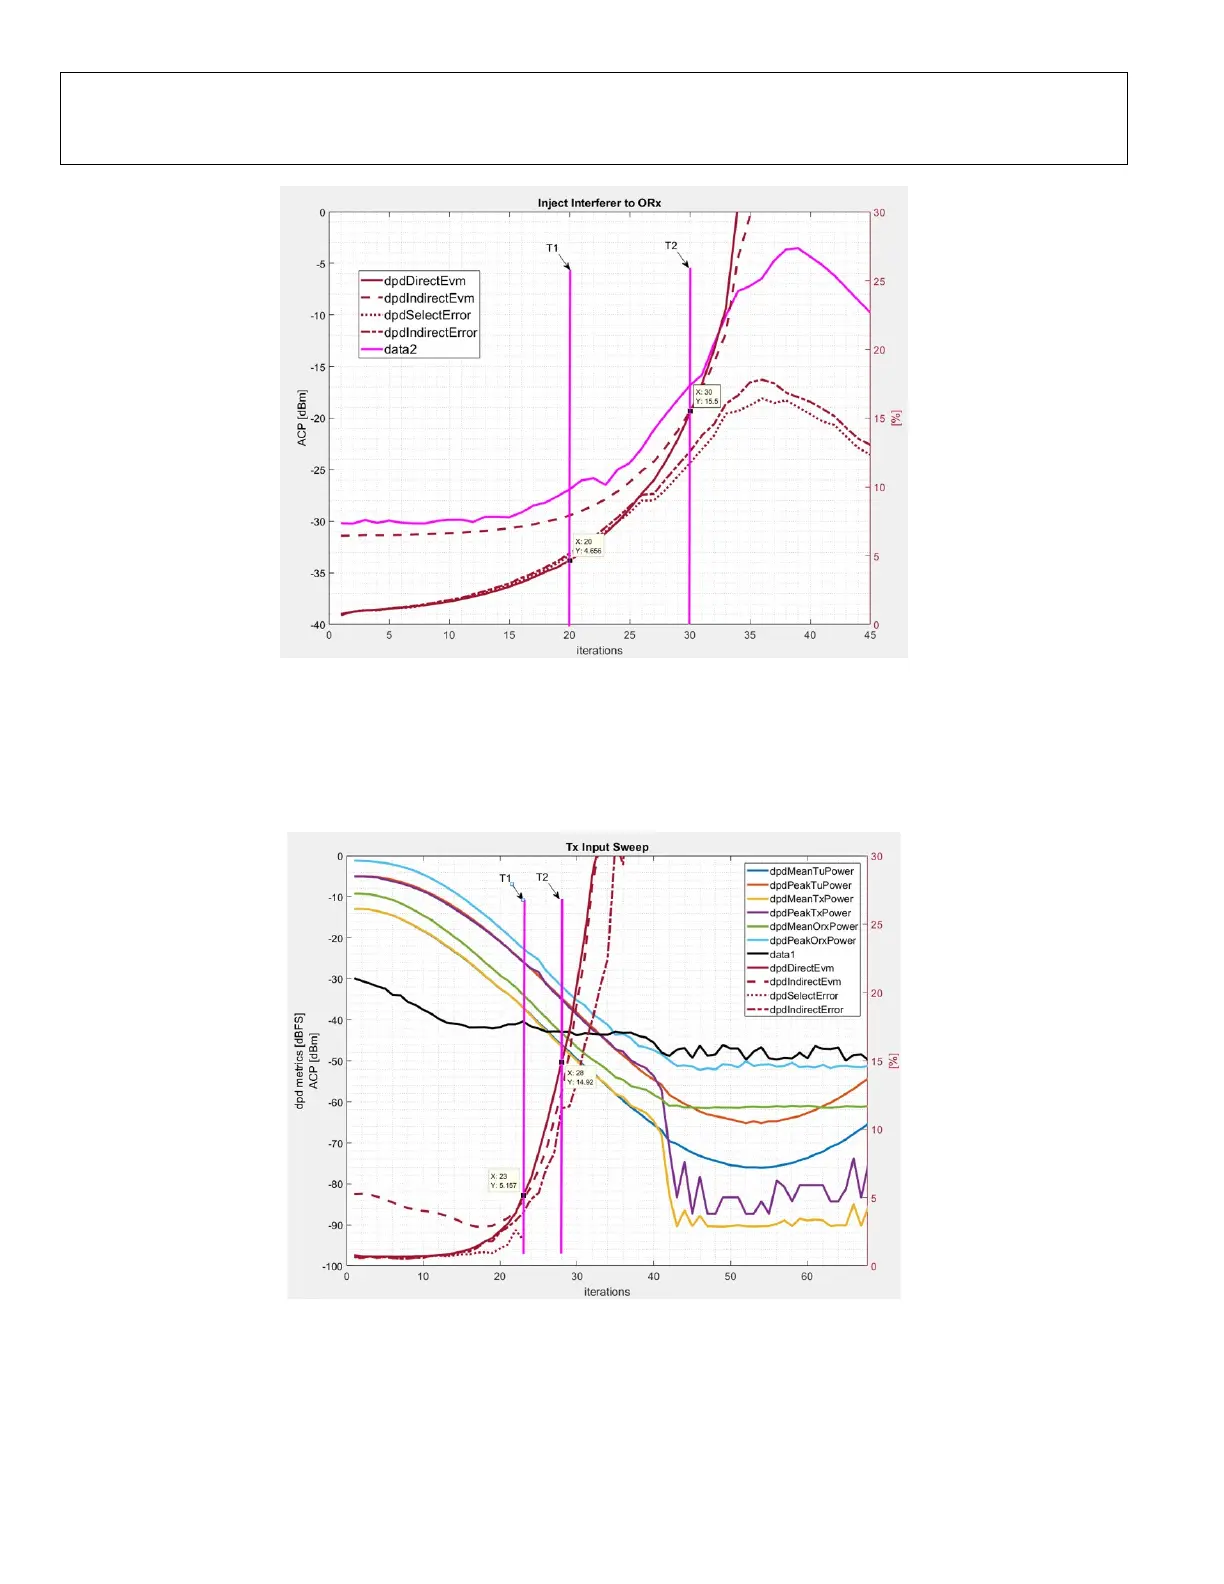
Shown in Figure 40 is the degradation of stability metrics with decreasing transmitter signal power. When the signal level is close
to –36 dBFS, it can be observed that the EVM percentages are close to 5%. At a transmitter signal level close to –46 dBFS, the
EVM percentages are close to 15%, causing further ACLR degradation.
Figure 40. Tx Signal Level vs ACLR Degradation
Summary
• DPD performance can be measured by direct EVM. The direct EVM numbers are lower when the performance on the DPD
adaptation is good.
• As ORx attenuation increases, an increase in EVM percentages can be observed.
 Loading...