Preliminary Technical
Data
Rev. PrA | Page 56 of 82
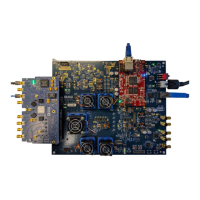
Figure 58. Enabling CFR Using TES
After clicking on ‘Apply’ (which runs the CFR init cal), the CFR engines will be enabled, and the corrected waveform can be
observed on the spectrum analyzer as shown in Figure 59.
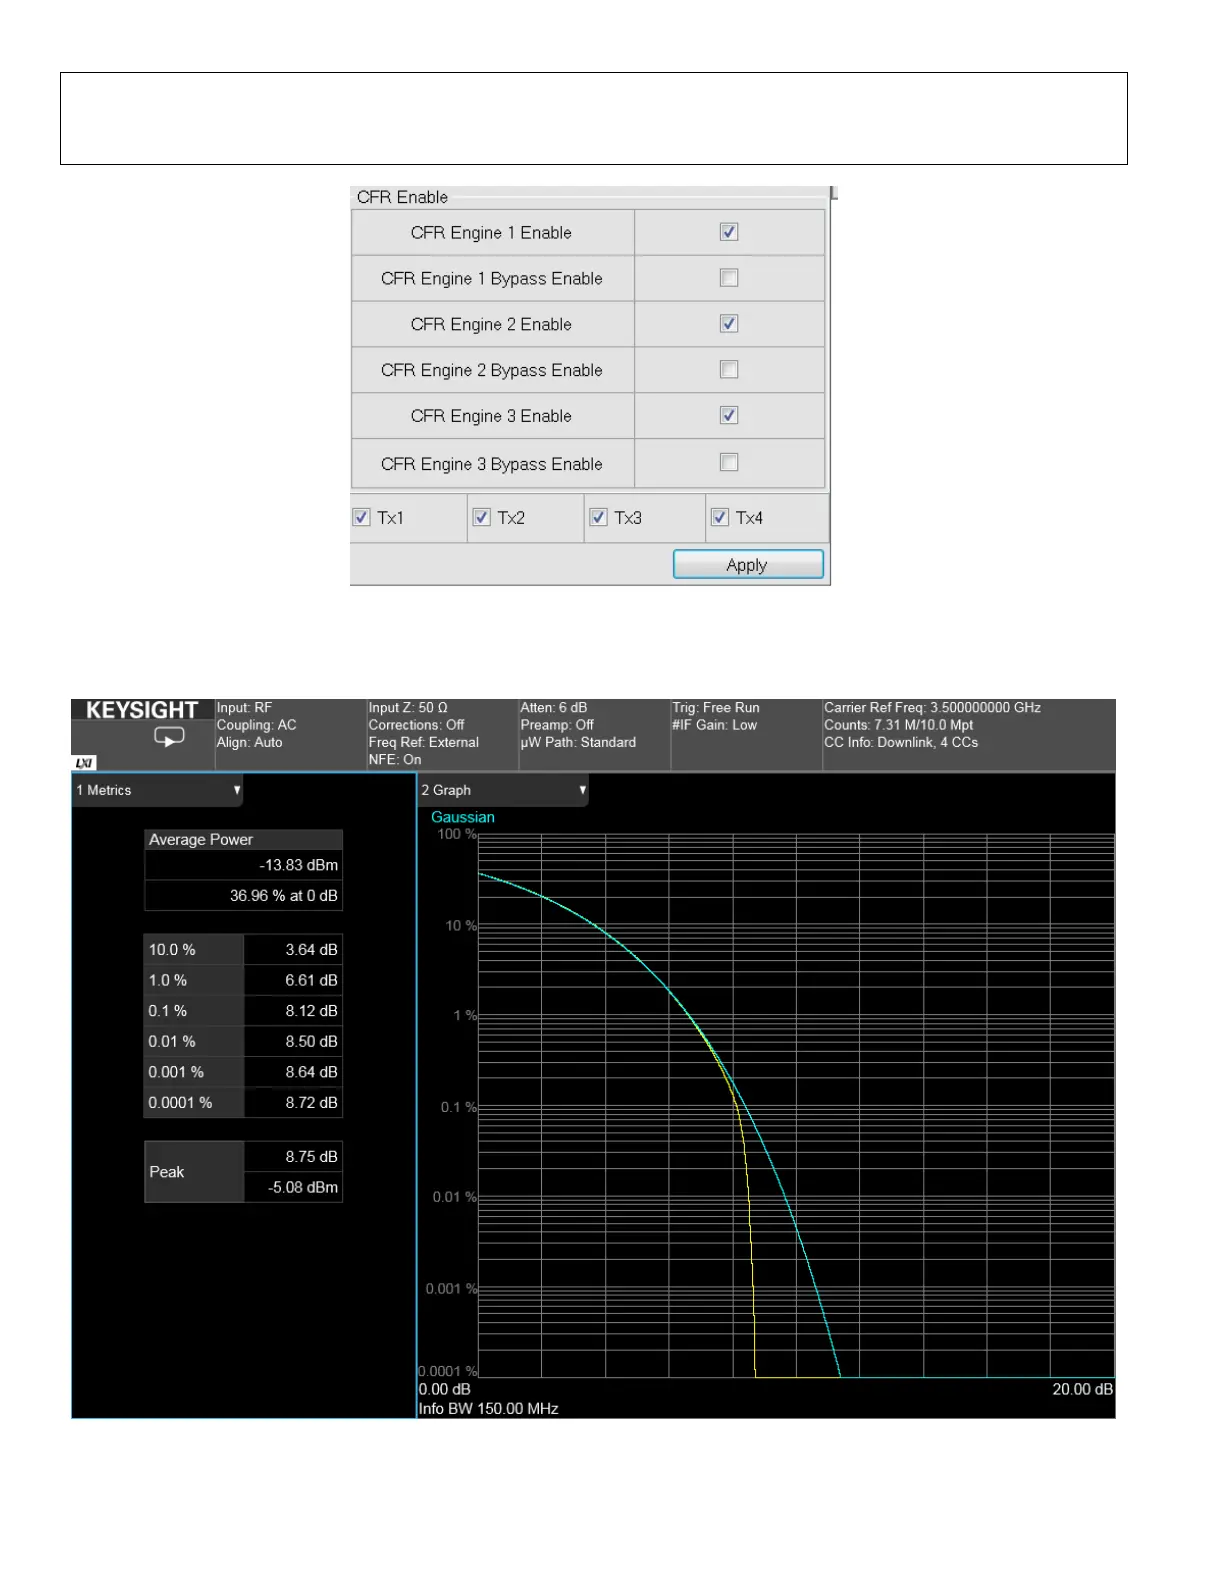
Figure 59. CCDF of Corrected Waveform Ssing CFR
As we can see in Figure 59, the corrected CCDF curve has a PAR of 8.75 dB which corresponds to the CFR peak threshold that we
had set earlier. We do not see any spectral regrowth and can achieve the desired PAR.
 Loading...