When the Chart (High Resolution) display is selected, a chart with an X-axis covering 4 minutes is
displayed. The value displayed on the Y-axis depends on the selection made in the input screen. Each chart
dot represents 1 second.
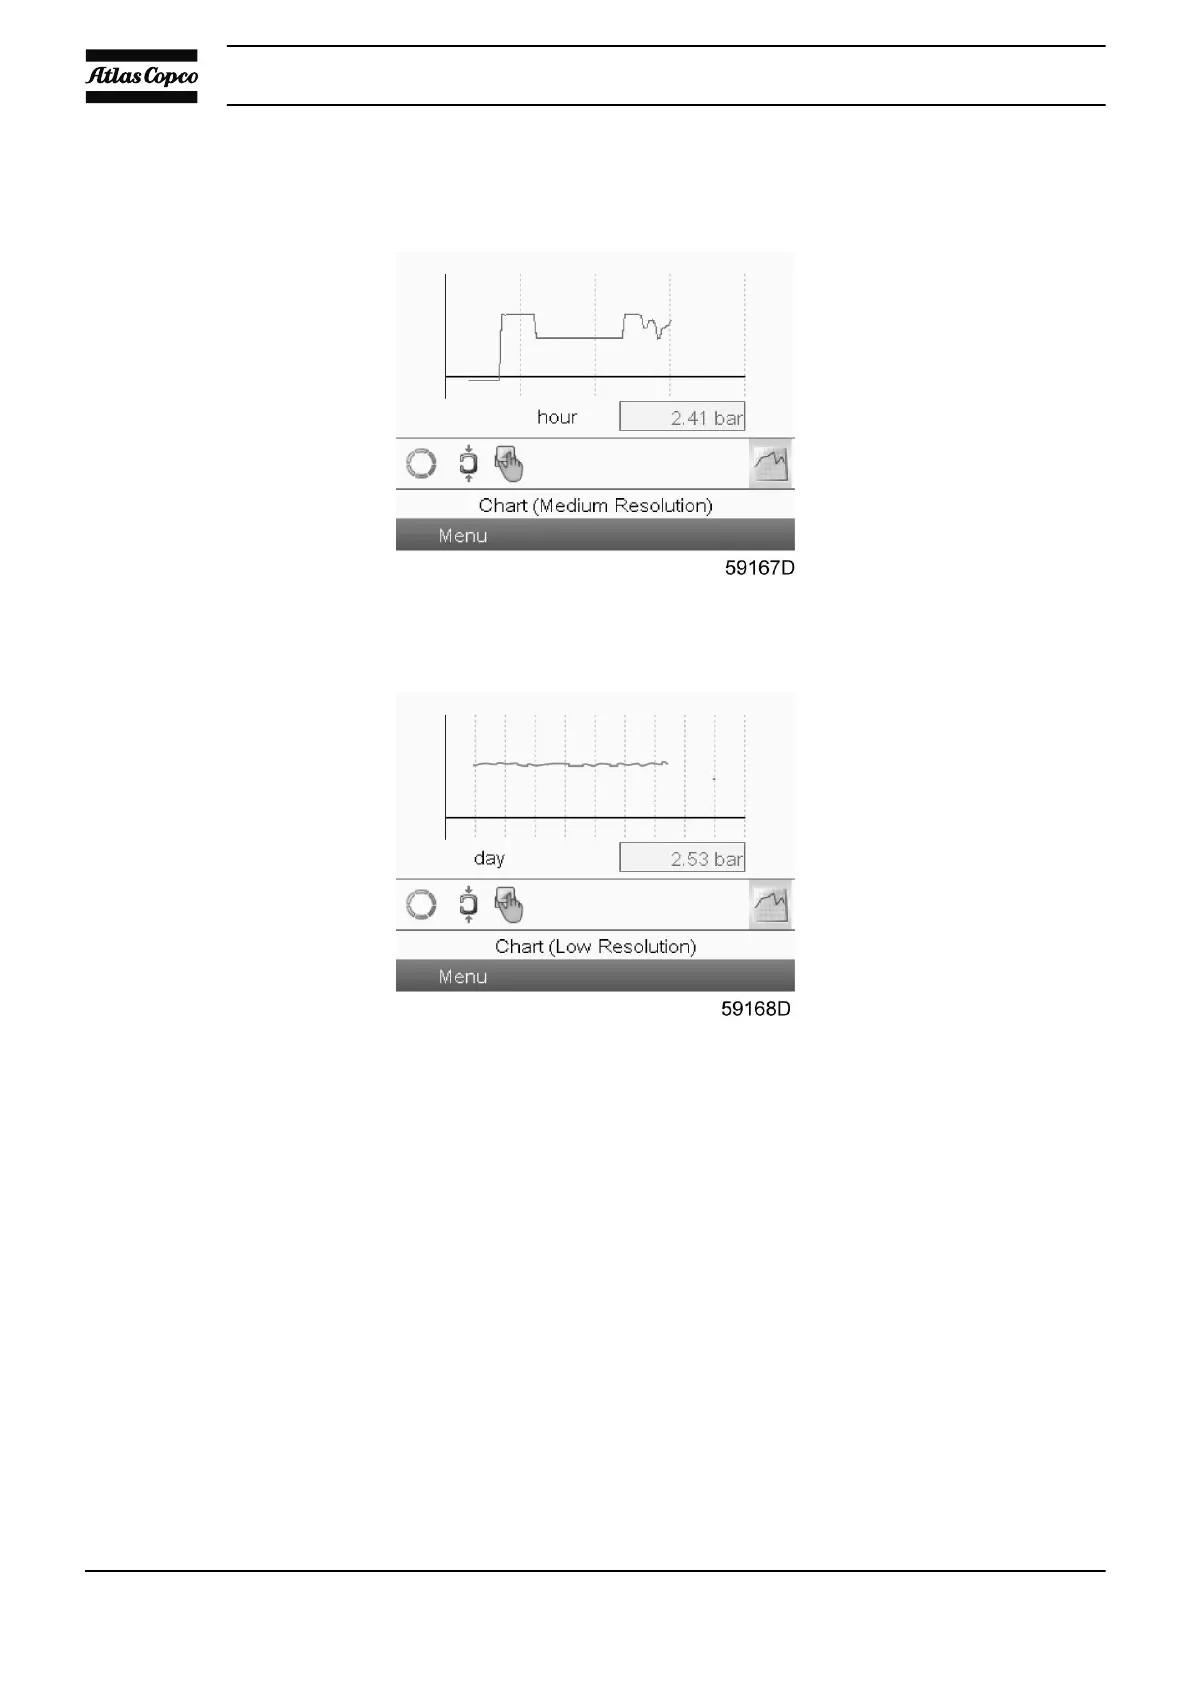
When the Chart (Medium Resolution) display is selected, a chart with an X-axis covering 4 hours is
displayed. The value displayed on the Y-axis depends on the selection made in the input screen. Each chart
dot represents a 1 minute average value.
When the Chart (Low Resolution) display is selected, a chart with an X-axis covering 10 days is displayed.
The value displayed on the Y-axis depends on the selection made in the input screen. Each chart dot
represents a 1 hour average value.
Instruction book
124 2920 1815 04
 Loading...