39
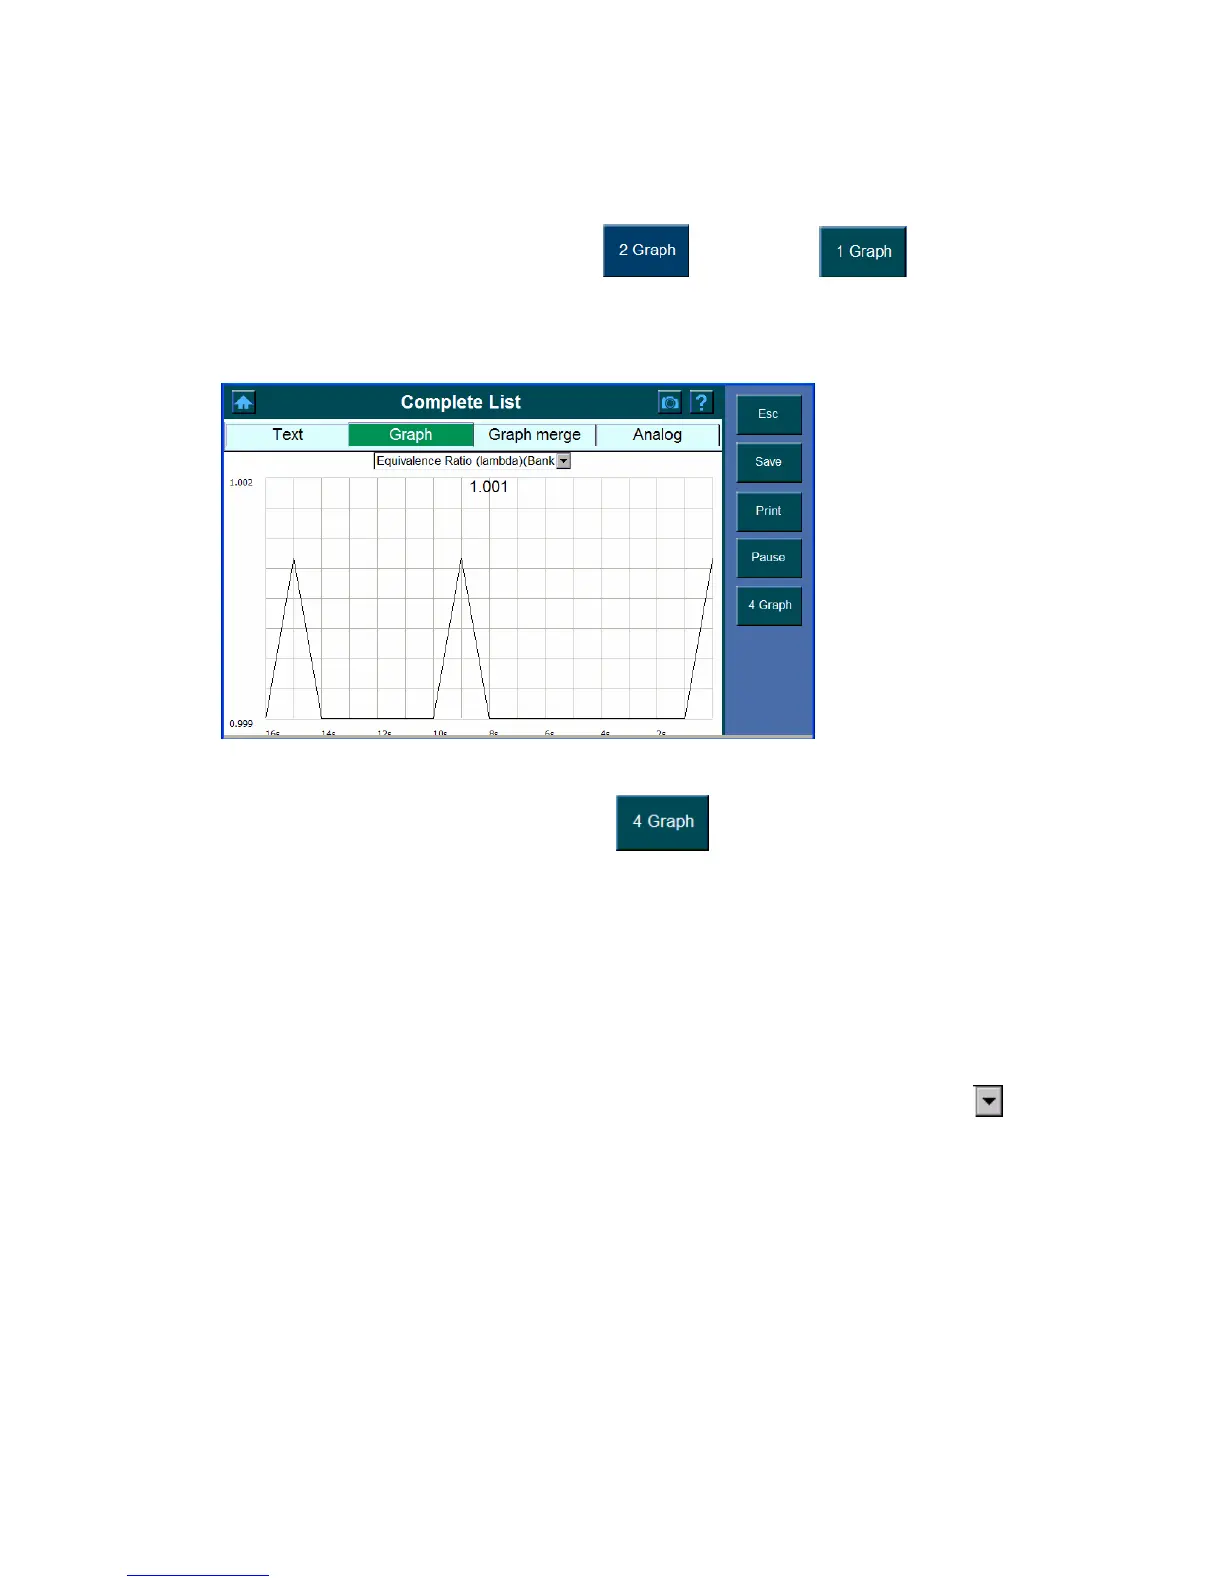
Note: If the graph shown on the screen is not the parameter you wish to view,
select the desired item from the pull down dialog box.
z To view only one graph at a time, click and then click .
Note: If the graph shown on the screen is not the parameter you wish to view,
select the desired item from the pull down dialog box.
z To view four graphs at a time again, click
.
Graph merge
The graphical output allows the user to evaluate and compare the parameter. Graphed
logs can be evaluated for trends and compared for cause and effect determination.
Select Graph merge to show the parameter in one graph
1. Select the
data to be graphed from each of the pull down dialog box. Click the
button and highlight the parameter you wish to view.