1.6C Medical Benefits
• Improved accuracy
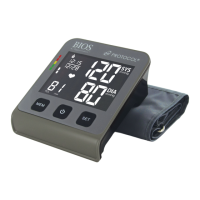
1.6D Measurement Sequence
• Single results are not displayed
• Due to the “Data Analysis” result, a 4th or 5th measurement may be applied. The following illustration
provides a flow chart of the MAM Sequence
2. Getting Started
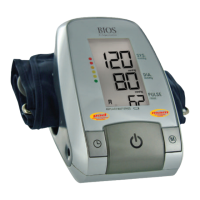
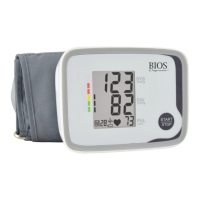
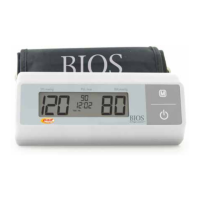
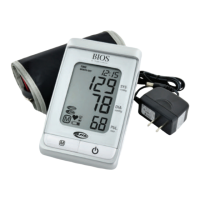
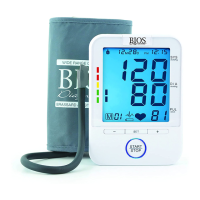
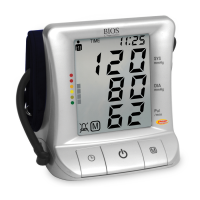
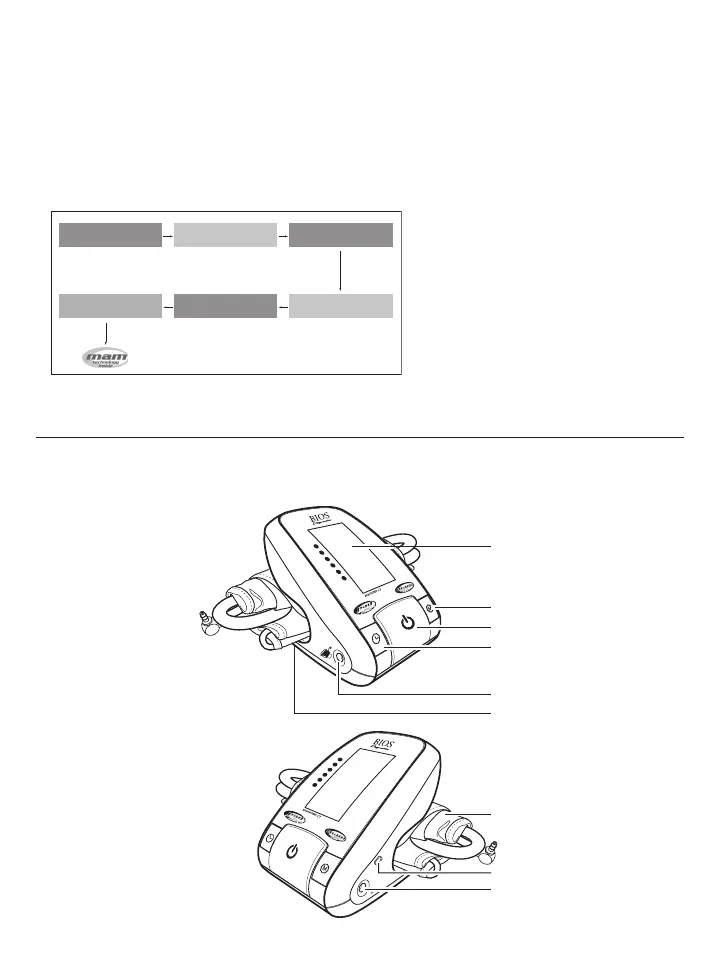
2.1 About the BD850
This section describes the various components of the BD850.
Measurement 1 Measurement 2
15 Second RestMeasurement 3Data Analysis
Result
15 Second Rest
Diagram 1
S
Y
S
.
m
m
H
g
D
I
A
.
m
m
Hg
P
U
L
S
E
/
m
i
n
3
9
2
S
Y
S
.
m
m
H
g
D
IA
.
m
m
H
g
PU
L
SE
/m
i
n
1
4
6
7
5
8