"2ECALLING-EMORYIN$-ODE
First select 7D Mode, then press the “+” or “-“ button.
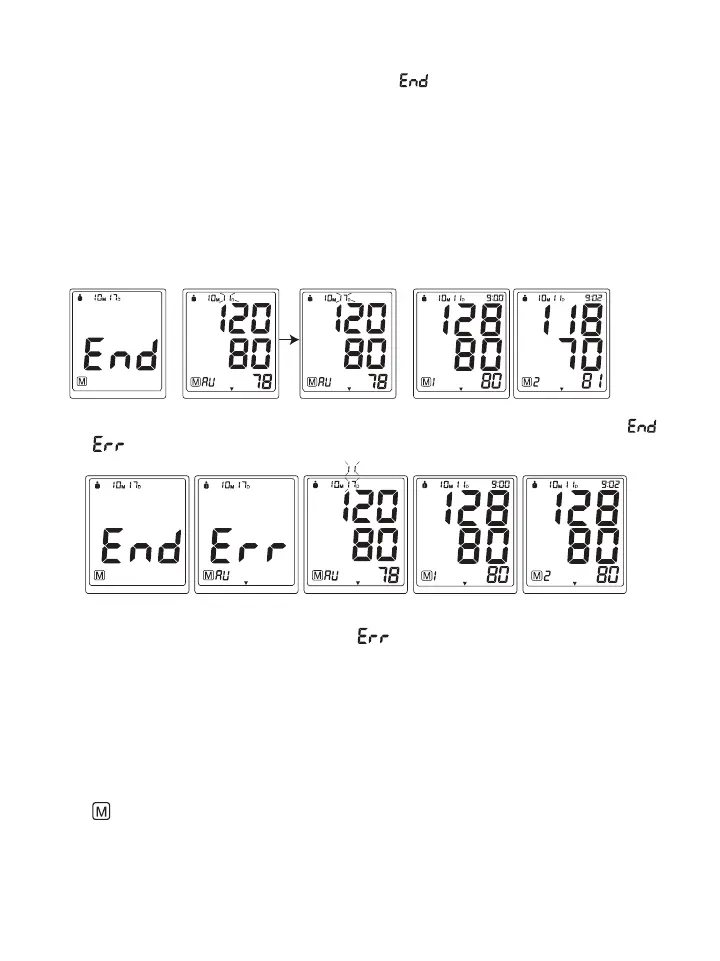
A. If the Protocol was done correctly, the monitor will display “
”, meaning all 28 measurements have
been saved in the memory, and then display the Average Measurement as per the Protocol software. In the
Average Measurement screen the date will display the second day the Protocol measurements were started
and then change to the 7
th
day the Protocol measurements ended.
&OREXAMPLE If the first day of measurements are started on October 10th and ends 7 days later on October
17th, the date will appear as 10M11D then change to 10M17D and back and forth . 10M11D will display instead
of 10M10D because the Protocol disregards the first day of measurements and averages the last 6 days of
measurements, see section 3.4 for more explanation.
Press the “+” or “-“ button to display the subsequent measurements.
7D mode General mode 7D mode General mode 7D mode General mode 7D mode General mode 7D mode General mode
B. If the Protocol was done incorrectly or if any measurements were missed, the monitor will display “ ”
then “ ” then the average measurement and then display the subsequent measurements.
7D mode General mode 7D mode General mode 7D mode General mode 7D mode General mode 7D mode General mode
2EASONSWHYTHE0ROTOCOL3OFTWAREISDISPLAYING
- Not enough measurements have been saved in memory. For the Protocol Software to work correctly there
needs to be 28 measurements saved in memory, 4 measurements taken for 7 days.
3.9 Clear Measurements From Memory
If you are sure that you want to permanently remove all stored memories, first choose the mode you want to delete
the memory from, then press the SET button 9 times until “CL” appears when the power is off. Press the34!24
STOP button until “CL” flashes 3 times to clear the memory. After this, press either the “+” or “-” button, the
symbols “ ” and “no” will appear on the screen. This means that the memory has successfully cleared.
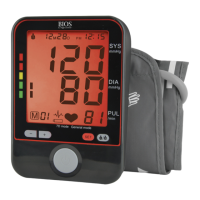
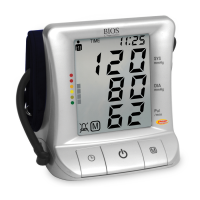
"LOOD0RESSURE!SSESSMENT)NDICATOR
The bars on the left hand side of the display show you the range within which the indicated blood pressure
values lies. Depending on the height of the bar, the readout value is either within the normal (green), borderline
(yellow) or danger (red) range.