Operating Temperatures and Pressures | 35SM Split CS Series Heat Pump
8733825873 (2020/05)SM Split CS Series Heat Pump
Subject to change without prior notice
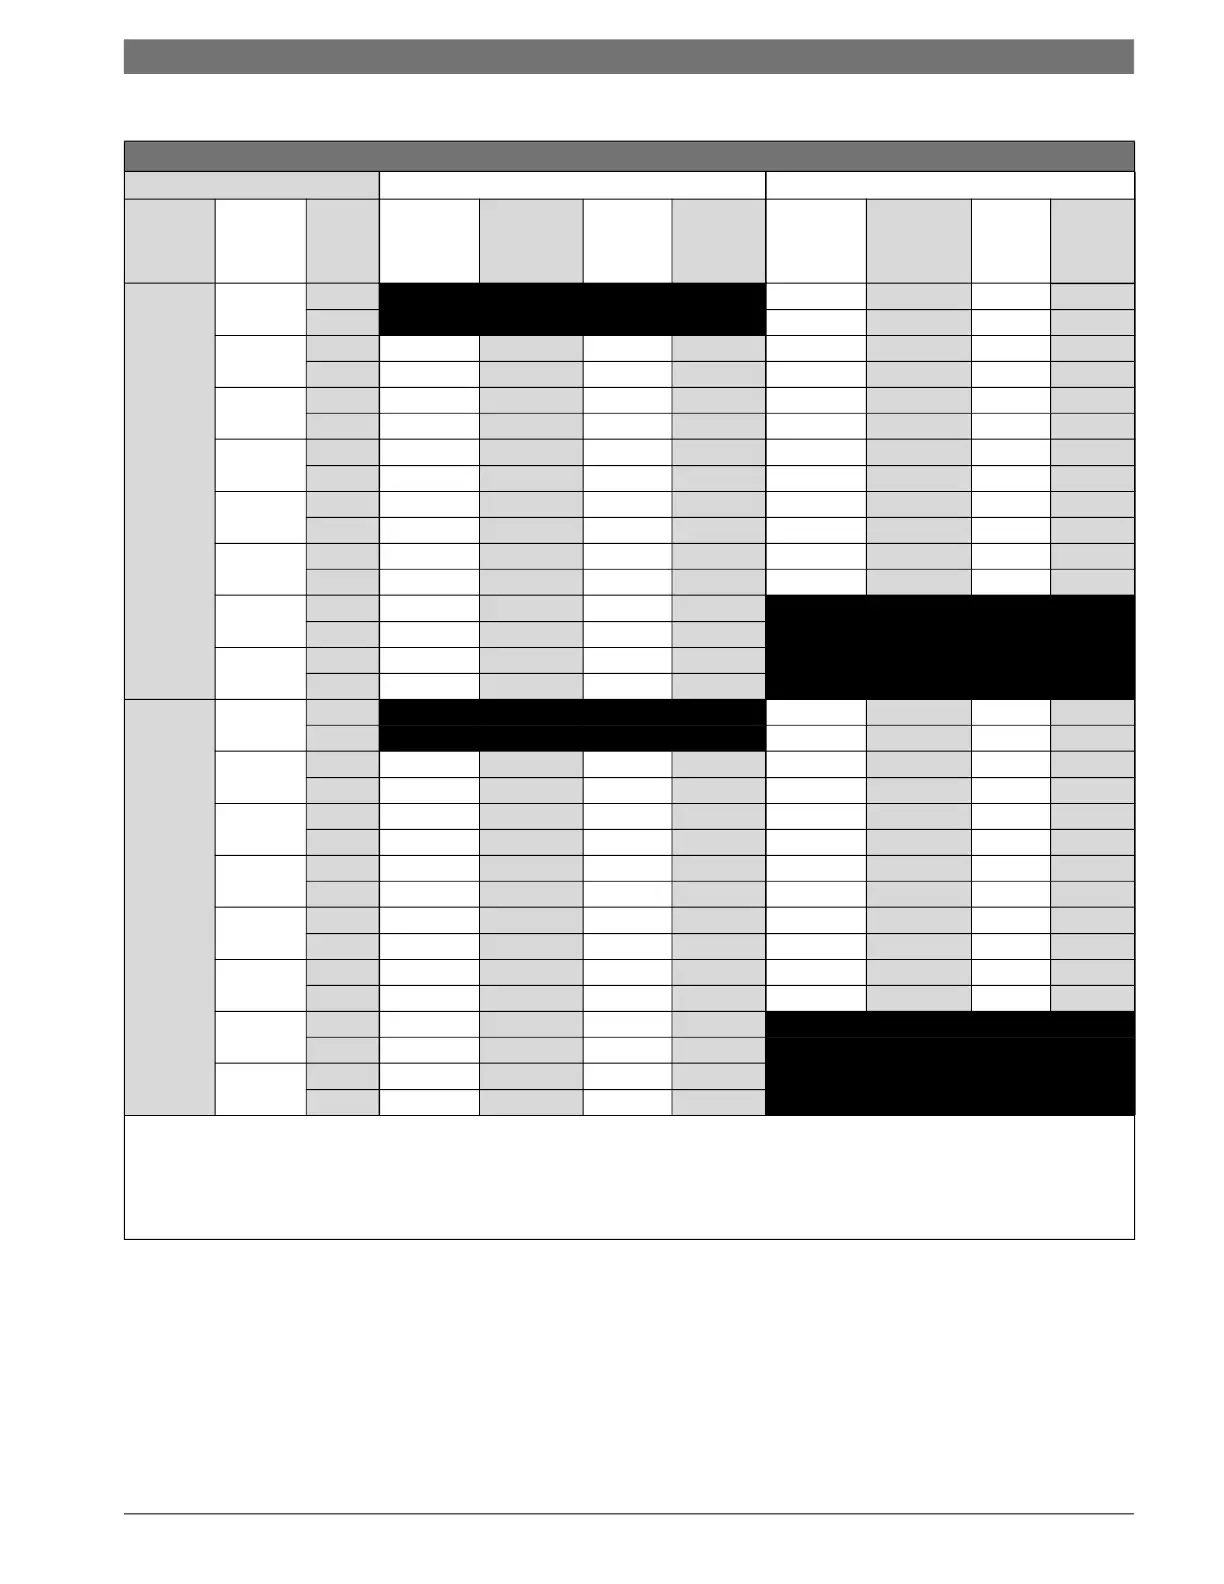
Table 20 SM060 Operating Temperatures and Pressures
Operating Temperatures and Pressures
Cooling Heating
Model
Entering
Water
Temp. F
Water
Flow
Suction
Pressure
PSIG
Discharge
Pressure
PSIG
Water
Temp.
Rise °F
Air
Temp.
Drop °F
Suction
Pressure
PSIG
Discharge
Pressure
PSIG
Water
Temp.
Drop
Air
Temp.
Rise °F
SM060
PART
LOAD
30°
7.0 68–84 256–313 5–7 19–23
14.0 73–89 261–319 4–5 20–25
40°
7.0 113–138 172–210 18–22 19–23 81–99 277–339 7–8 22–26
14.0 110–134 161–196 12–14 20–24 86–105 283–346 5–6 23–28
50°
7.0 116–142 206–252 17–21 19–23 93–114 299–365 8–9 24–29
14.0 112–137 193–236 12–14 19–24 99–121 305–373 6–7 25–31
60°
7.0 118–145 241–294 17–21 18–23 106–129 321–392 9–11 26–32
14.0 115–140 225–275 11–14 19–23 113–138 327–400 7–8 28–34
70°
7.0 121–148 275–336 17–21 18–22 118–145 342–418 10–12 29–35
14.0 117–143 257–314 11–14 19–23 126–154 349–427 8–9 30–37
80°
7.0 123–151 309–378 16–20 18–22 131–160 364–444 11–14 31–38
14.0 120–146 289–353 11–13 19–23 139–170 371–454 8–10 33–40
90°
7.0 132–161 348–426 13–16 18–22
14.0 128–156 326–398 10–12 19–23
100°
7.0 128–157 378–462 16–19 17–21
14.0 125–152 353–432 11–13 18–22
SM060
FULL
LOAD
30°
7.0 68–84 256–313 5–7 19–23
14.0 73–89 261–319 4–5 20–25
40°
7.0 117–143 182–222 15–19 21–26 81–99 277–339 7–8 22–26
14.0 114–139 170–208 11–14 22–27 86–105 283–346 5–6 23–28
50°
7.0 120–147 215–263 15–18 20–25 93–114 299–365 8–9 24–29
14.0 117–143 201–246 11–14 21–26 99–121 305–373 6–7 25–31
60°
7.0 123–150 248–304 14–17 20–24 106–129 321–392 9–11 26–32
14.0 119–146 232–284 11–13 21–25 113–138 327–400 7–8 28–34
70°
7.0 126–154 282–344 14–17 19–24 118–145 342–418 10–12 29–35
14.0 122–149 263–322 10–13 20–25 126–154 349–427 8–9 30–37
80°
7.0 129–157 315–385 13–16 19–23 131–160 364–444 11–14 31–38
14.0 125–153 294–360 10–12 19–24 139–170 371–454 8–10 33–40
90°
7.0 132–161 348–426 13–16 18–22
14.0 128–156 326–398 10–12 19–23
100°
7.0 134–164 382–466 12–15 17–21
14.0 131–160 357–436 9–11 18–22
This chart shows approximate temperatures and pressures for a unit in good repair. The values shown
are meant as a guide only and should not be used to estimate system charge. This chart assumes rated
airflow and 80º d.b./67º w.b. entering air temperature in cooling, 70º d.b. entering air temperature in
heating. Heating data at entering fluid temperatures below 50º assumes the use of antifreeze. As a result
of continuing research and development, specifications are subject to change without notice.