Model 671 User’s Manual USING THE LASER WAVELENGTH METER
Bristol Instruments, Inc. 20
Trend Graph Zoom
The Trend Graph can be magnified to focus on a portion of the trending data.
Before zooming, left-click on the Trend Graph to ensure that the Trend Graph is
active, and uncheck “Autoscale Axes” under the View Menu.
• Horizontal Zooming – Scrolling the mouse wheel upwards will zoom in
horizontally on the spectrum at the mouse cursor location. Scrolling the
mouse wheel downwards will zoom out horizontally on the spectrum at the
mouse cursor location.
• Vertical Zooming – Holding the shift key on user’s keyboard while scrolling
the mouse wheel upwards will zoom in vertically on the Trend Graph at the
mouse cursor location. Holding down the shift key while scrolling the mouse
wheel downwards will zoom out vertically on the Trend Graph at the mouse
cursor location.
Trend Graph Panning
When the Trend Graph is zoomed, left-clicking and dragging in the Trend Graph
will pan the trending data horizontally. Holding down the Shift key while left-
clicking and dragging will pan the trending data vertically.
Menu Function Descriptions
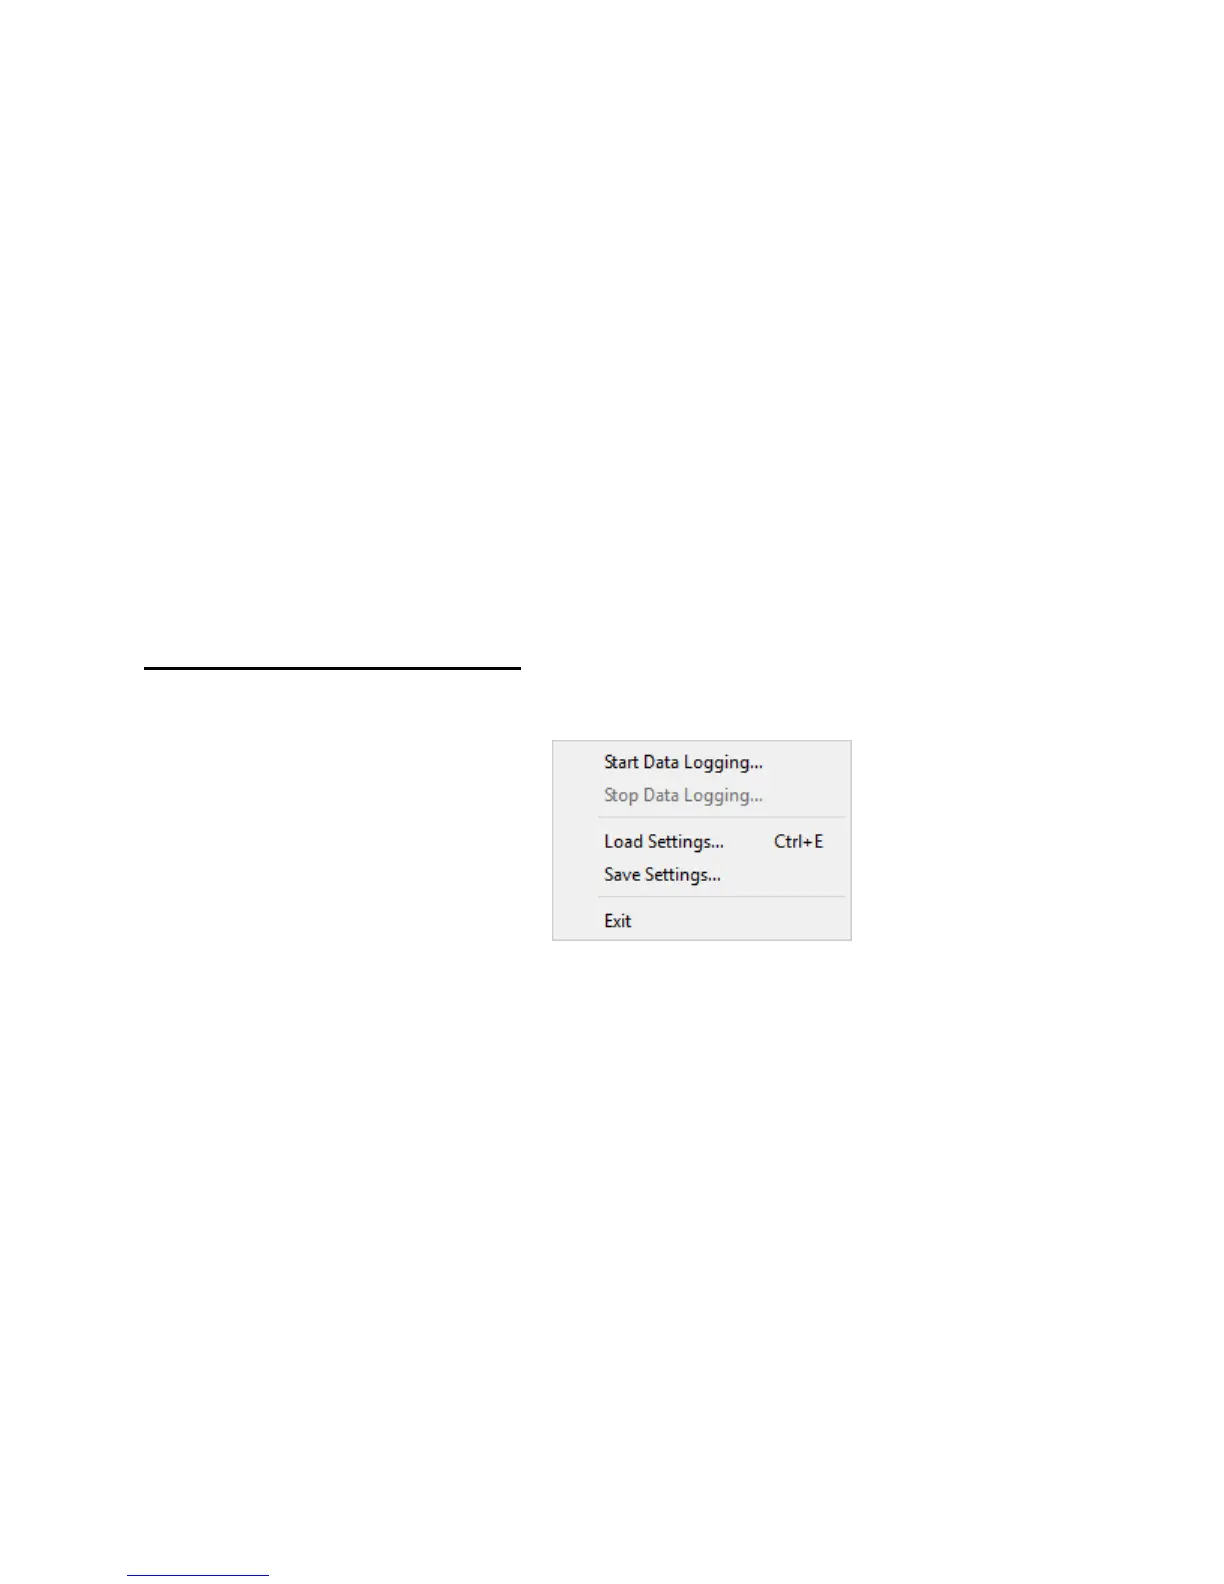
File Menu
• Start Data Logging – The instrument status, wavelength, and power measurements
can be logged in a Comma-Separated Value (*.csv) file format for use in other
graphing programs. If “Stop after..measurements” or “Stop after…hours, minutes,
seconds” are selected, logging will stop automatically after the specified number of
measurements or amount of time, respectively. If “Stop manually” is selected then
logging must be stopped manually by clicking the Stop Data Logging menu item. The
default file name is “NuView log 1.csv.” If you use this filename, the number at the
end will increment each time you begin a new log.
Each measurement can be logged, or measurements can be recorded at a
measurement or time interval.
The columns of the CSV file are defined by the available measurement parameters
listed below. The first column of the log file is a timestamp for each measurement,
followed by the selected parameters. Click the check box next to a parameter to
include that column in the CSV file.