key.
The
asymmetry
data
can
be dis-
played
either
in numerical form, or as
a
bargraph
(by pressing "Asymmetry"
twice).
This
latter
display is particu-
larly useful when finding
the
direction
of
maximum
temperature
asymmetry.
Air
Velocity
Th~?.
"Air Velocity" section
has
two
pushkeys;
"Mean
Value"
and
"Std. Dev".
When
"Mean
Value" is se-
lected two values are
obtained
on
the
Display.
The
left-hand
value is
the
air
velocity
measured
with
a 5 second
time
constant,
while
the
right-hand
value is a linear
three-minute-mean
air velocity.
The
displayed
three-min-
ute
value is
updated
every 10 seconds.
The
"Std. Dev."
pushkey
also provides
two values on
the
Display.
These
are
the
standard
deviations for
the
5 sec-
ond
and
three
minute
measurements.
Humidity
The
"Humidity"
section consists of
three
pushkeys; "Rel. Hum.",
"Vap. Pres."
and
"Dewpoint". Mea-
surements
of relative
humidity
can
only be
obtained
if
both
the
Air
Tem-
perature
and
Humidity
Transducers
are connected
to
the
Analyzer.
The
atmospheric
partial
water
vapour
pressure (measured
in
kPa.)
can
be
displayed using
the
"Vap. Pres." push-
key, while
the
dew-point
temperature
is
obtained
using
the
"Dew-point"
pushkey.
Mode
Three
pushkeys ("Display", "Re-
cord"
and
"Replay
/Plot")
determine
the
operating mode of
the
Indoor
Cli-
mate
Analyzer.
These
pushkeys are
grouped in
the
centre
of
the
front
pan-
el
and
their
operation
is described in
the
"Operation" section below.
Recording
Time
The
"Recording
Time"
pushkeys on
the
right-
hand
side
of
the
front
panel
are normally only
activated
in
the
"Record" mode, when
they
are
used to
select
the
measurement
period over
which
the
data
are
to
be recorded. A
choice of four periods (1,
6,
24
and
120
hours) is available. However,
in
either
"Display" or "Replay
/Plot"
mode,
the
"120
h/Units"
pushkey
converts
the
displayed
data
from S.l.
to
Imperial
units
or vice versa.
Outputs
The
Indoor
Climate Analyzer has
three
output
sockets
on
the
rear
panel
(2
BNC
and
one 8--pin "Recorder").
The
output
obtained
is
dependent
upon
the
operating
mode
of
the
Type
1213 (see "Operation" section).
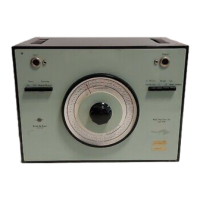
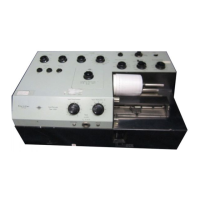
6
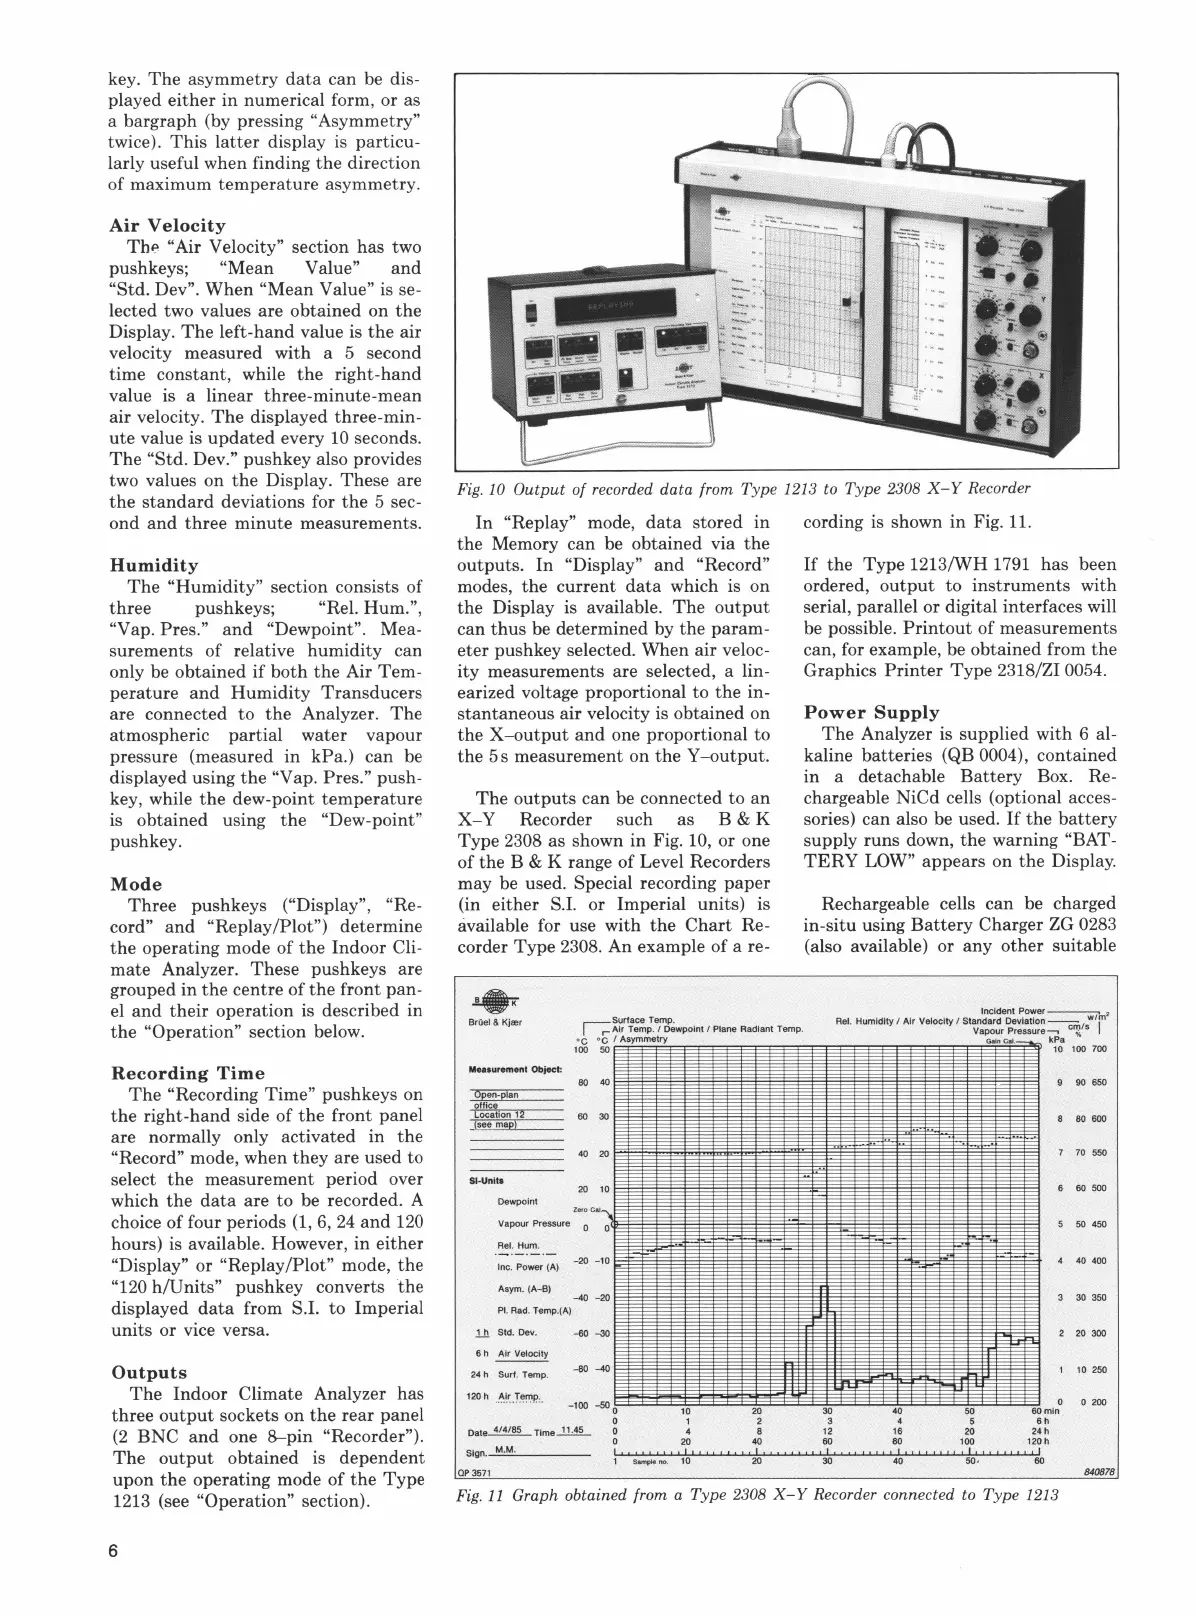
Fig.
10
Output
of
recorded data from
Type
1213 to
Type
2308
X-Y
Recorder
In
"Replay" mode,
data
stored
in
the
Memory
can
be
obtained
via
the
outputs.
In
"Display"
and
"Record"
modes,
the
current
data
which is
on
the
Display is available.
The
output
can
thus
be
determined
by
the
param-
eter
pushkey selected. When air veloc-
ity
measurements
are selected, a lin-
earized voltage proportional to
the
in-
stantaneous
air velocity is
obtained
on
the
X-output
and
one proportional
to
the
5 s
measurement
on
the
Y
-output.
The
outputs
can
be connected to
an
X-
Y Recorder such as B & K
Type
2308 as shown
in
Fig. 10, or one
of
the
B & K range of Level Recorders
may be used.
Special recording
paper
(in
either
S.l. or Imperial units) is
available for use with
the
Chart
Re-
corder
Type
2308. An example
of
a re-
BrOel
& Kjrer
!r~~:~~~~;etJ'ewpoint
I Plane Radiant Temp.
100 50
Measurement
Object:
80
40
Open-plan
office
Location
12
60 30
(see map)
40
20
SI-Unita
20
10
Dewpoint
Zero
Cat.....,.
Vapour Pressure
0
0
Rei.
Hum.
Asym. (A-B)
-40
-20
Pl
. Rad. Temp.(A)
1Jl Std. Dev.
-60
-30
6 h Air Velocity
24
h Surf. Temp.
-80
-40
120
h
-
~ir
_
T
_
ernP.
:.
-100
-50
0
10
1
4
20
0
Date~
Time..!!.:§_
0
0
Sign. M.M.
I.
Ill,,,,,,,,
I I
1
Sampleno
.
10
QP
3571
20
2
8
40
..
I,
20
cording is shown
in
Fig. 11.
If
the
Type
1213/WH 1791
has
been
ordered,
output
to
instruments
with
serial, parallel or digital interfaces will
be possible.
Printout
of
measurements
can, for example, be
obtained
from
the
Graphics
Printer
Type
2318/ZI 0054.
Power
Supply
The
Analyzer is
supplied
with 6 al-
kaline
batteries
(QB 0004),
contained
in a detachable
Battery
Box. Re-
chargeable
NiCd
cells (optional acces-
sories)
can
also be used.
If
the
battery
supply
runs
down,
the
warning "BAT-
TERY
LOW"
appears
on
the
Display.
Rechargeable cells
can
be charged
in-situ
using
Battery
Charger ZG 0283
(also available) or
any
other
suitable
30
3
12
60
I
!I
30
40
50
4 5
16
20
80 100
''""""'I"
40
50·
9
90
650
8 80 600
7
70
550
6 60 500
5
50
450
4
40
400
3 30 350
2
20
300
1
10
250
0
SO
min
6h
24h
120h
0 200
'"""
60
840878
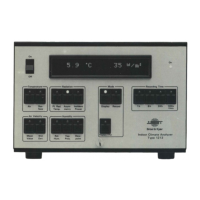
Fig.
11
Graph obtained from a
Type
2308
X-Y
Recorder connected to
Type
1213
 Loading...