20070201
5-2-6
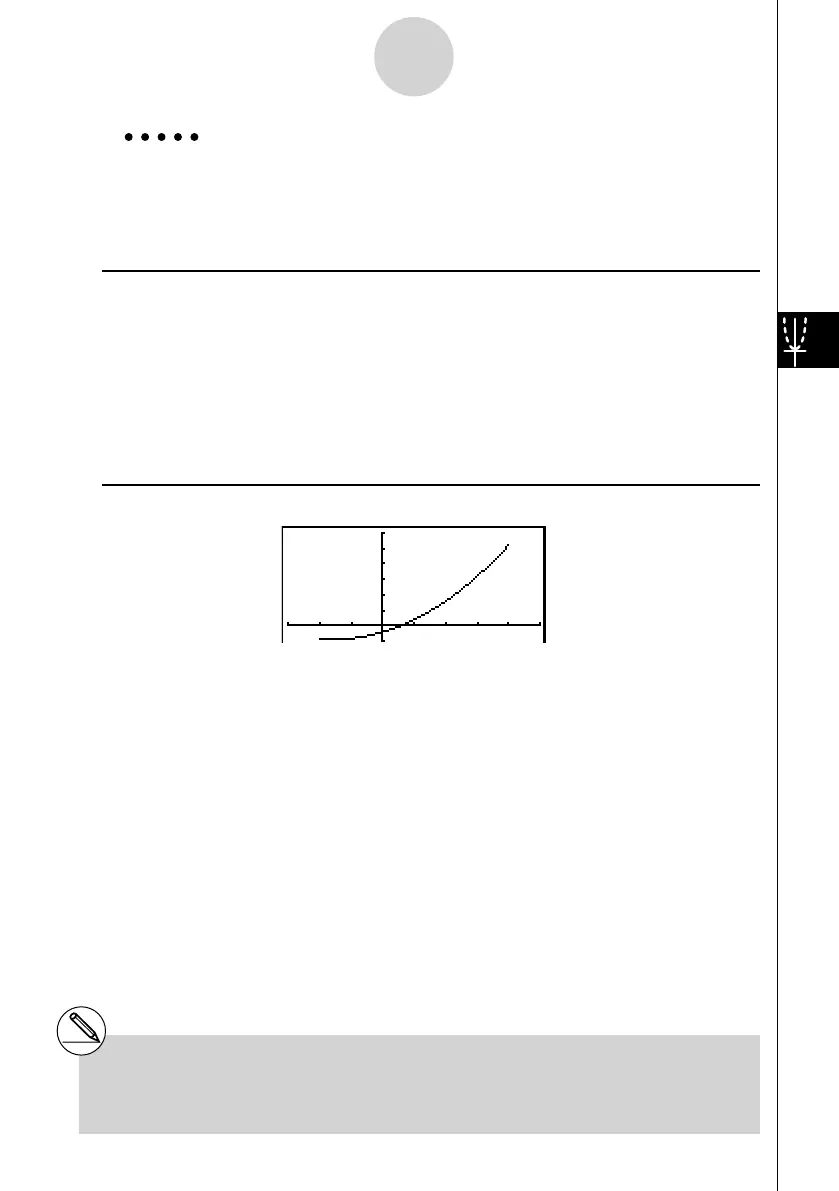
Controlling What Appears on a Graph Screen
Example Graph
y = x
2
+ 3 x – 2 within the range – 2 < x < 4
Use the following V-Window settings.
Xmin = –3, Xmax = 5, Xscale = 1
Ymin = –10, Ymax = 30, Yscale = 5
Procedure
1 m GRAPH
2 !3 (V-WIN)- d w f w b w c
- ba w da w f wJ
3 3 (TYPE)1 (Y=)vx +d v -c,
! + ( [ )- c,e ! - ( ] )w
4 6 (DRAW)
Result Screen
# You can specify a range when graphing
rectangular expressions, polar expressions,
parametric functions, and inequalities.