20070201
5-6-4
Manual Graphing
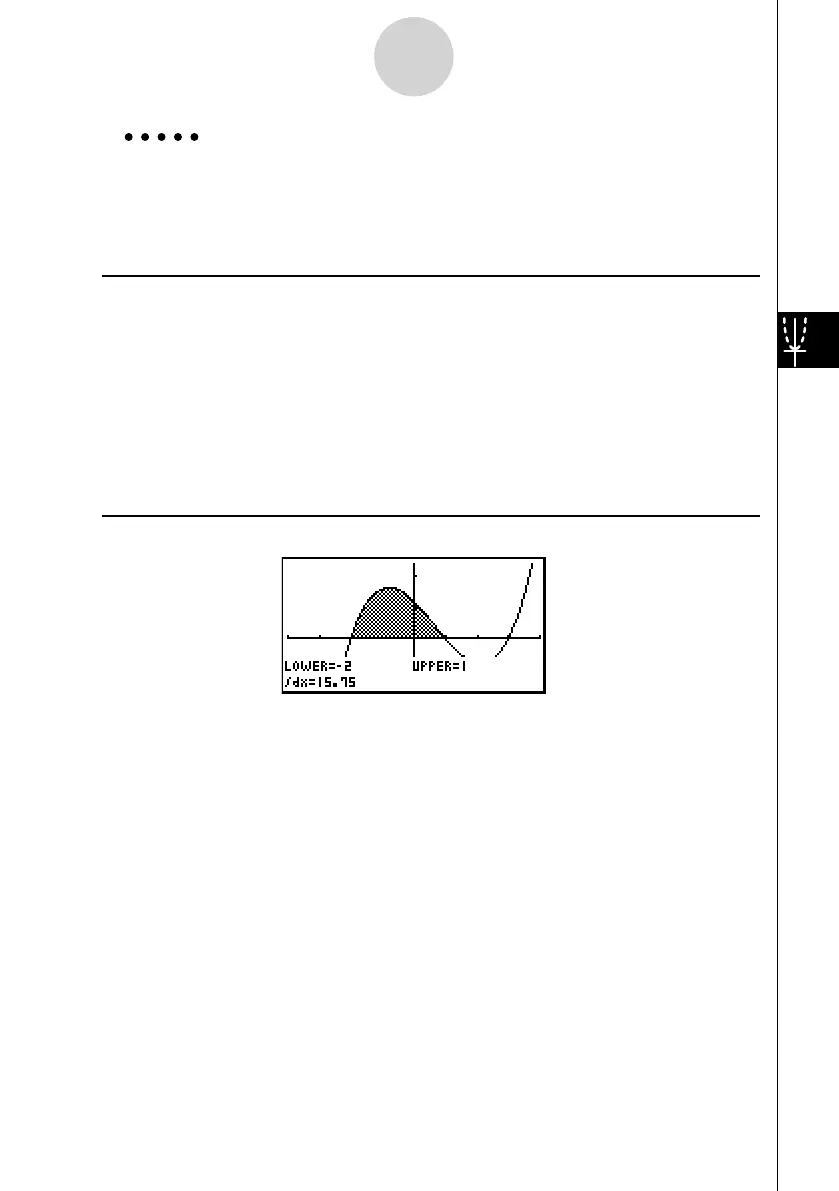
Example Graph the integration
1
–2
( x + 2)( x – 1)( x – 3) dx .
Use the following V-Window settings.
Xmin = –4, Xmax = 4, Xscale = 1
Ymin = –8, Ymax = 12, Yscale = 5
Procedure
1 m RUN
•
MAT
2 !3 (V-WIN) - e w e w b w c
- i w bc w f wJ
3 !4 (SKTCH)1 (Cls)w
5 (GRPH)5 (G
• ∫ dx )
4 ( v +c)( v -b)( v -d),
- c,b w
Result Screen