20070201
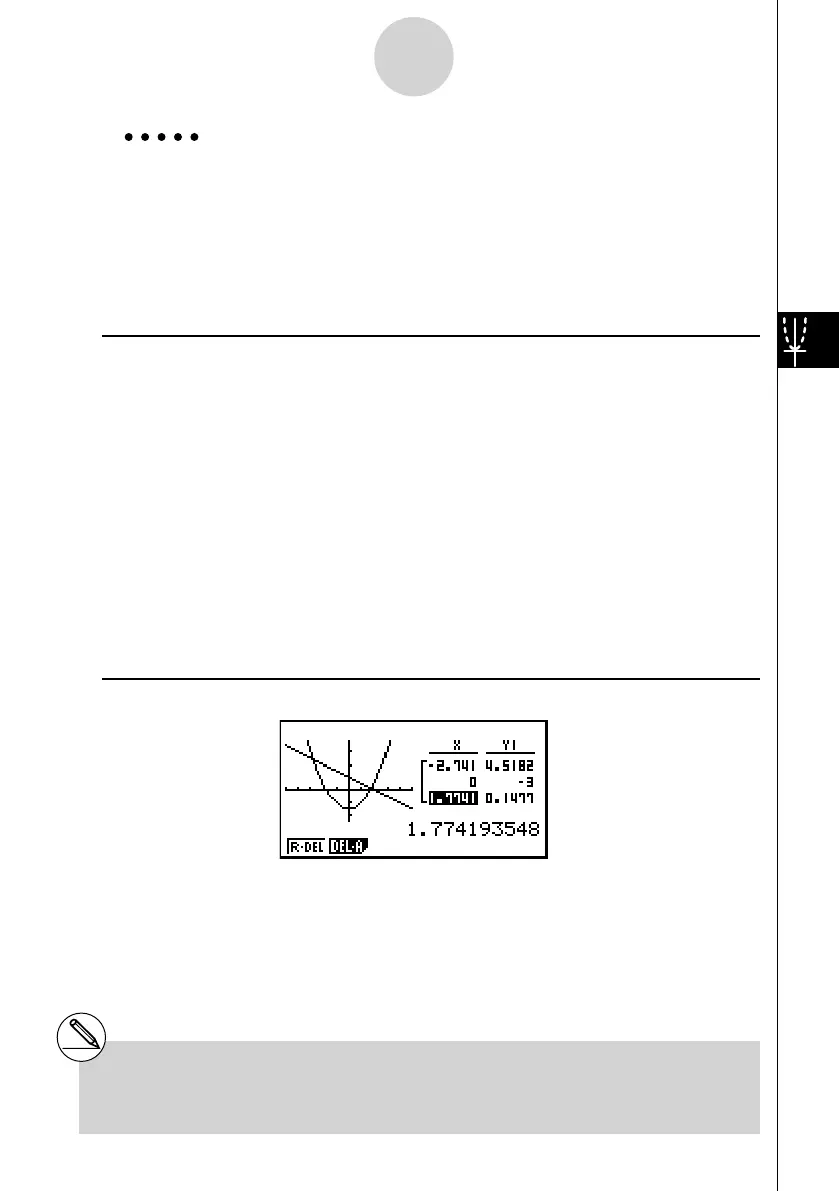
Example Save, in a table, the coordinates in the vicinity of the points of
intersection at X = 0 for the two graphs shown below, and store the
table contents in List 1.
Y1 =
x
2
– 3, Y2 = – x + 2
Use the following V-Window settings.
Xmin = –5, Xmax = 5, Xscale = 1
Ymin = –10, Ymax = 10, Yscale = 2
Procedure
1 m GRAPH
2 !m (SET UP)cc 2 (GtoT)J
3 !3 (V-WIN) - f w f w b w c
- ba w ba w c wJ
4 3 (TYPE)1 (Y=) vx -d w
-v +c w
6 (DRAW)
5 !1 (TRCE)
6 d ~d w e ~e w
7 K 1 (CHNG)
8 K 2 (LMEM)b w
Result Screen
5-11-6
Function Analysis
# Instead of pressing K 1 (CHNG) in step 7,
you could press A to make the number table
active.