20070201
u Normal Distribution Probability
Normal distribution probability calculates the probability of normal distribution data falling
between two specifi c values.
a : lower boundary
b : upper boundary
Perform the following key operations from the statistical data list.
5 (DIST)
1 (NORM)
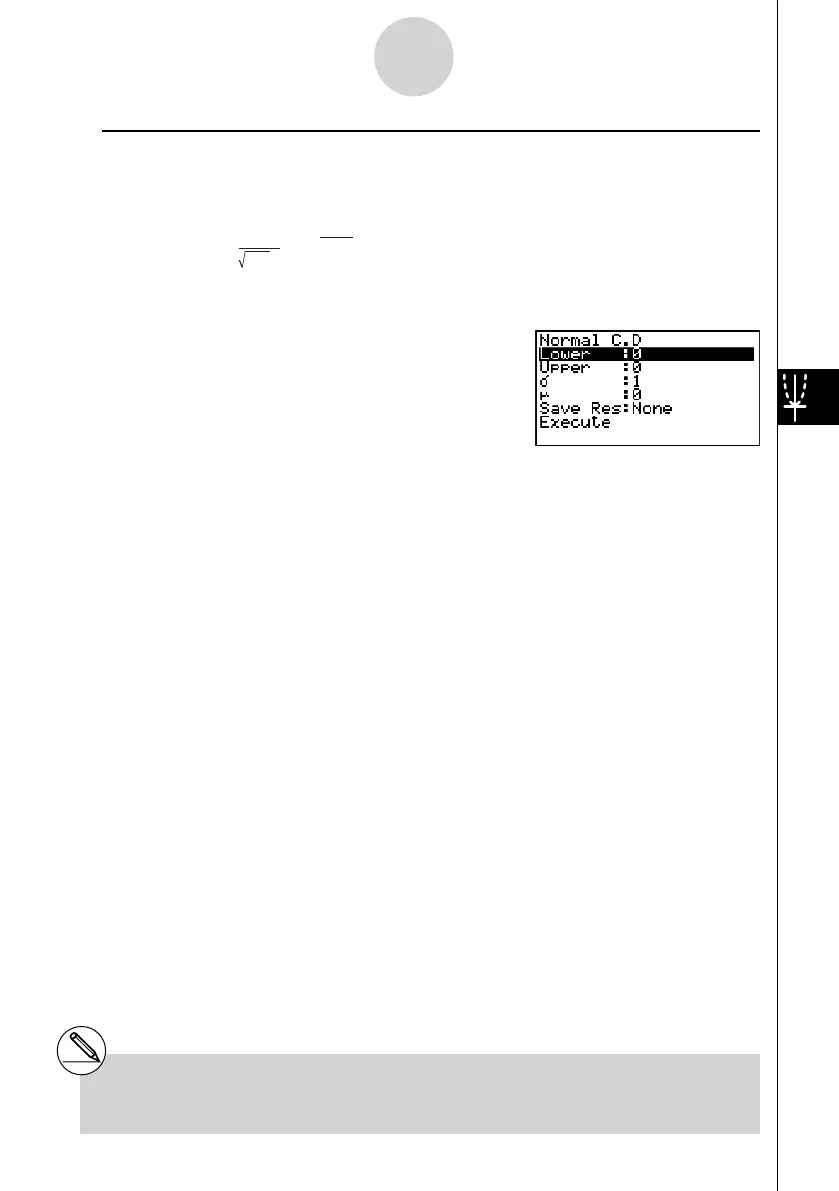
2 (Ncd)
Data is specifi ed using parameter specifi cation. The following shows the meaning of each
item.
Lower .......................... lower boundary
Upper .......................... upper boundary
σ
................................. standard deviation (
σ
> 0)
μ
................................. mean
Save Res .................... list for storage of calculation results (None or List 1 to 26)
Execute ....................... executes a calculation
After setting all the parameters, use c to move the highlighting to “Execute” and then press
the function key shown below to perform the calculation.
• 1 (CALC) ... Performs the calculation.
πσ
2
p =
1
e
–
dx
2
2
σ
(x – μ)
2
μ
a
b
∫
πσ
2
p =
1
e
–
dx
2
2
σ
(x – μ)
2
μ
a
b
∫
# There is no graphing for normal distribution
probability.
6-7-4
Distribution
 Loading...


