20070201
8-6-11
Using Calculator Functions in Programs
1
!m6631
2
4121J
3
11J
4
24J
5
J4141
6
!J621
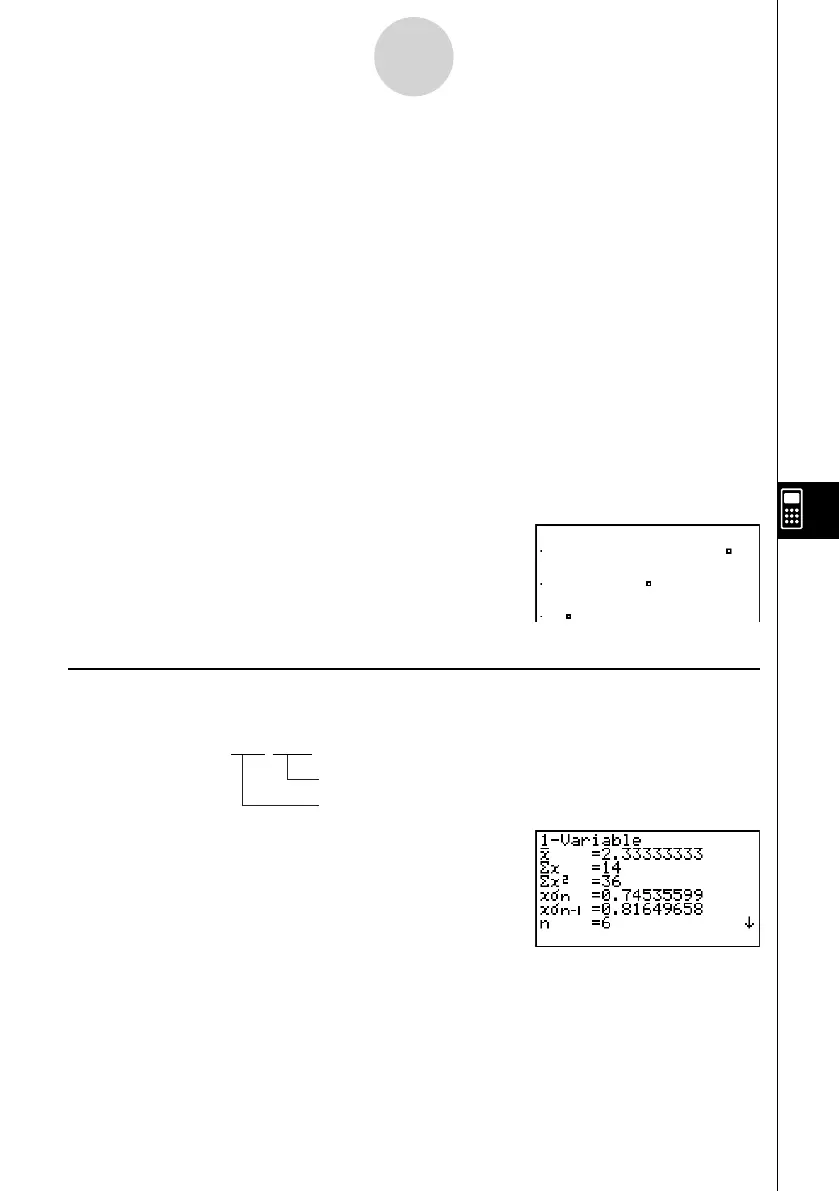
Executing this program produces the scatter
diagram shown here.
k Performing Statistical Calculations
• Single-variable statistical calculation
1
1-Variable List1 , List 2
Frequency data (Frequency)
x -axis data (XList)
1
4161
• The following is a typical graph condition specifi cation for a sinusoidal regression graph.
S-Gph1 DrawOn, Sinusoidal, List 1, List 2 _
• The following is a typical graph condition specifi cation for a logistic regression graph.
S-Gph1 DrawOn, Logistic, List 1, List 2 _
Example Program
ClrGraph_
1
S-Wind Auto_
{1, 2, 3} → List 1_
{1, 2, 3} → List 2_
23 4 5
S-Gph1 DrawOn, Scatter, List 1, List 2, 1, Square _
6
DrawStat