20070201
9-6-6
Statistical Graphs
k Confi guring the Frequency Setting
The frequency is a value that specifi es how many times each of the statistical data items is
repeated. A value of 1 is the initial default for this setting. With this setting, each data item (
x )
or data pair ( x , y ) is represented as one point on the graph.
In cases where there is a large amount of data, however, plotting one point per data item (
x )
or data pair (
x , y ) can cause the graph to become cluttered and diffi cult to read. If this
happens, you can specify a frequency value for each data item, which will reduce the number
of plots of very frequent data items and make the graph easier to read.
u To specify the frequency of each data item
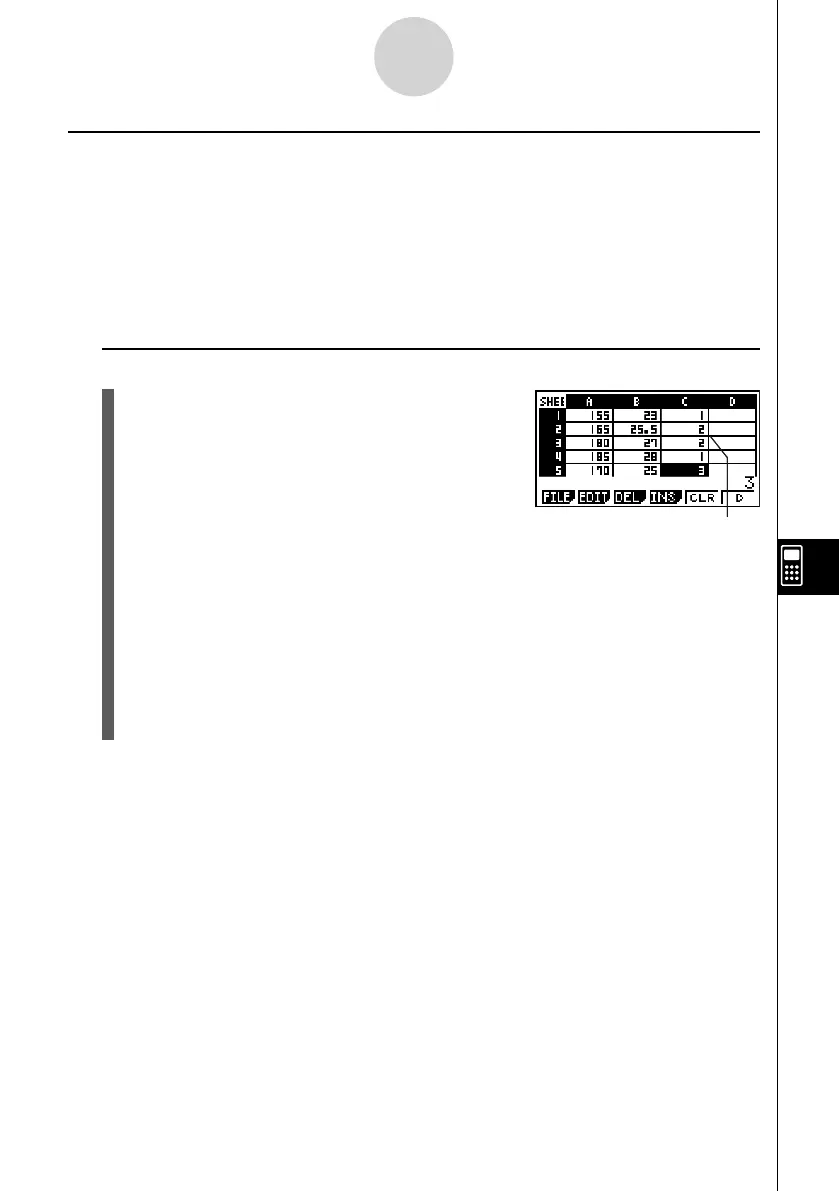
1. Input the frequency values on the spreadsheet.
• For this example, input the frequency values for
the example data on page 9-6-3.
Frequency column (C)
2. Press 6 (SET) on the GRPH submenu to display the graph settings screen.
3. Use the f and c cursor keys to move the highlighting to Frequency.
4. Press 2 (CELL).
• This enables cell range input for the Frequency setting. The function menu will change
to the colon (:).
5. Input the range of the cells that specify the frequencies (C1:C5 in this example).
• To input the colon (:), press 1 (:).
6. After the setting is the way you want, press J .