20070201
10-1-7
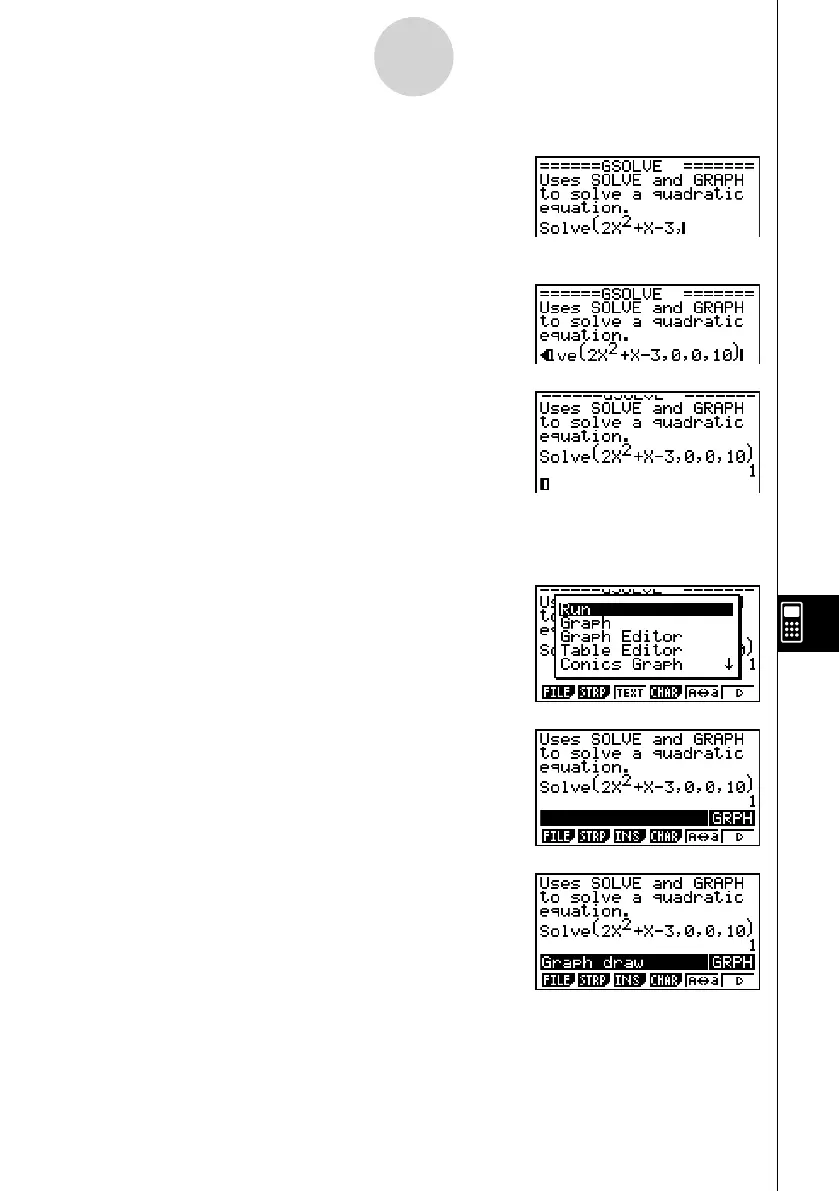
eActivity Overview
2. Specify the Solve calculation, and then enter the function.
A K 4 (CALC)1 (Solve)
c vx + v -d,
3. Input the initial estimate value, the lower limit, and the upper limit.
a,a,ba)
4. Press w to solve for x .
• This will display the solution ( x = 1) and move the
cursor to the beginning of the next line.
5. Press J twice to close the option (OPTN) menu.
5. Now to draw a graph, insert a Graph strip into the eActivity.
1. Press 2 (STRP).
• This will display a dialog box with a list of
insertable strips.
2. On the list, select “Graph”, and then press w .
• This will insert a Graph strip, ready for you to input
a title.
3. Type a title for the list (“Graph draw” for this
example), and then press w .
• This will register the title and highlight the strip.