20070201
8. Call up the List Editor screen (page 6-1-1).
• Press ! , ( , ) to display the application list, select List Editor, and then press
w .
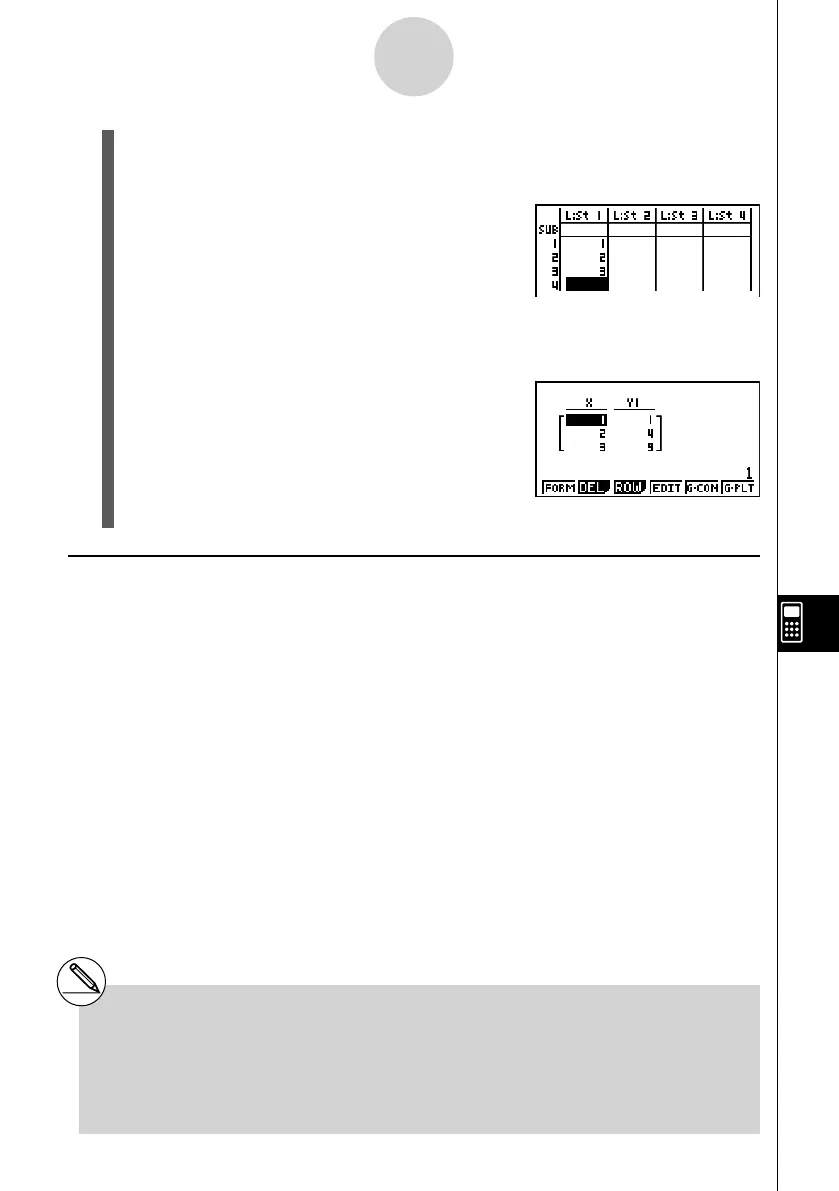
9. Input the values into List 1.
10. Return to the Table Editor screen.
• Press ! , ( , ) to display the application list, select Table Editor, and then press
w .
11. When the Table Editor screen appears, press w .
• This generates the number table for the function
y = x
2
using the values in List 1 as the x -variable
range.
12. To return to the eActivity workspace screen, press ! a ( ' ).
k Using Copy and Paste to Draw a Graph
You can paste a previously copied function from the clipboard into a graph screen called up
from a Graph strip. If you do, however, the pasted data will not be refl ected in the function
stored in the memory of the Graph strip. Use copy and paste when you need a quick,
temporary look at the graph produced by a function.
10-3-16
Inputting and Editing eActivity File Data
# After returning to the eActivity workspace
screen in step 12, you can press w to display
the Table Editor screen, which will contain
the function you input. Pressing w while the
Table Editor screen is on the display will return
to the number table in step 11.
# As you can see in this example all data and
settings related to the application screen called
up from a strip are stored in strip memory.