 Loading...
Do you have a question about the Cisco ASR1006 - ASR 1006 Modular Expansion Base and is the answer not in the manual?
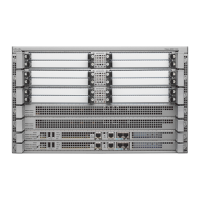
| Rack Units | 6U |
|---|---|
| Form Factor | Rack-mountable |
| Operating Temperature | 32 to 104°F (0 to 40°C) |
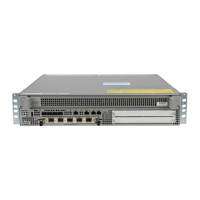
| Product Type | Router |
| Slots | 6 |
| Redundancy | Redundant Power Supply Supported |
| Maximum Throughput | 100 Gbps |
| Dimensions | 17.5" Width |
| Weight | Approximately 130 lbs (59 kg) |
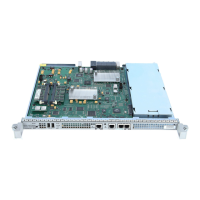
| Interfaces/Ports | Varies by installed modules |
| Memory | 4 GB |
| Storage Temperature | -40°F to 158°F (-40°C to 70°C) |
| Relative Humidity | 5% to 95% (noncondensing) |
| Compliance | CE, UL |