Dashboard
Port Utilization
Cisco Sx350, SG350X, SG350XG, Sx550X & SG550XG Series Managed Switches, Firmware Release 2.2.5.x 26
2
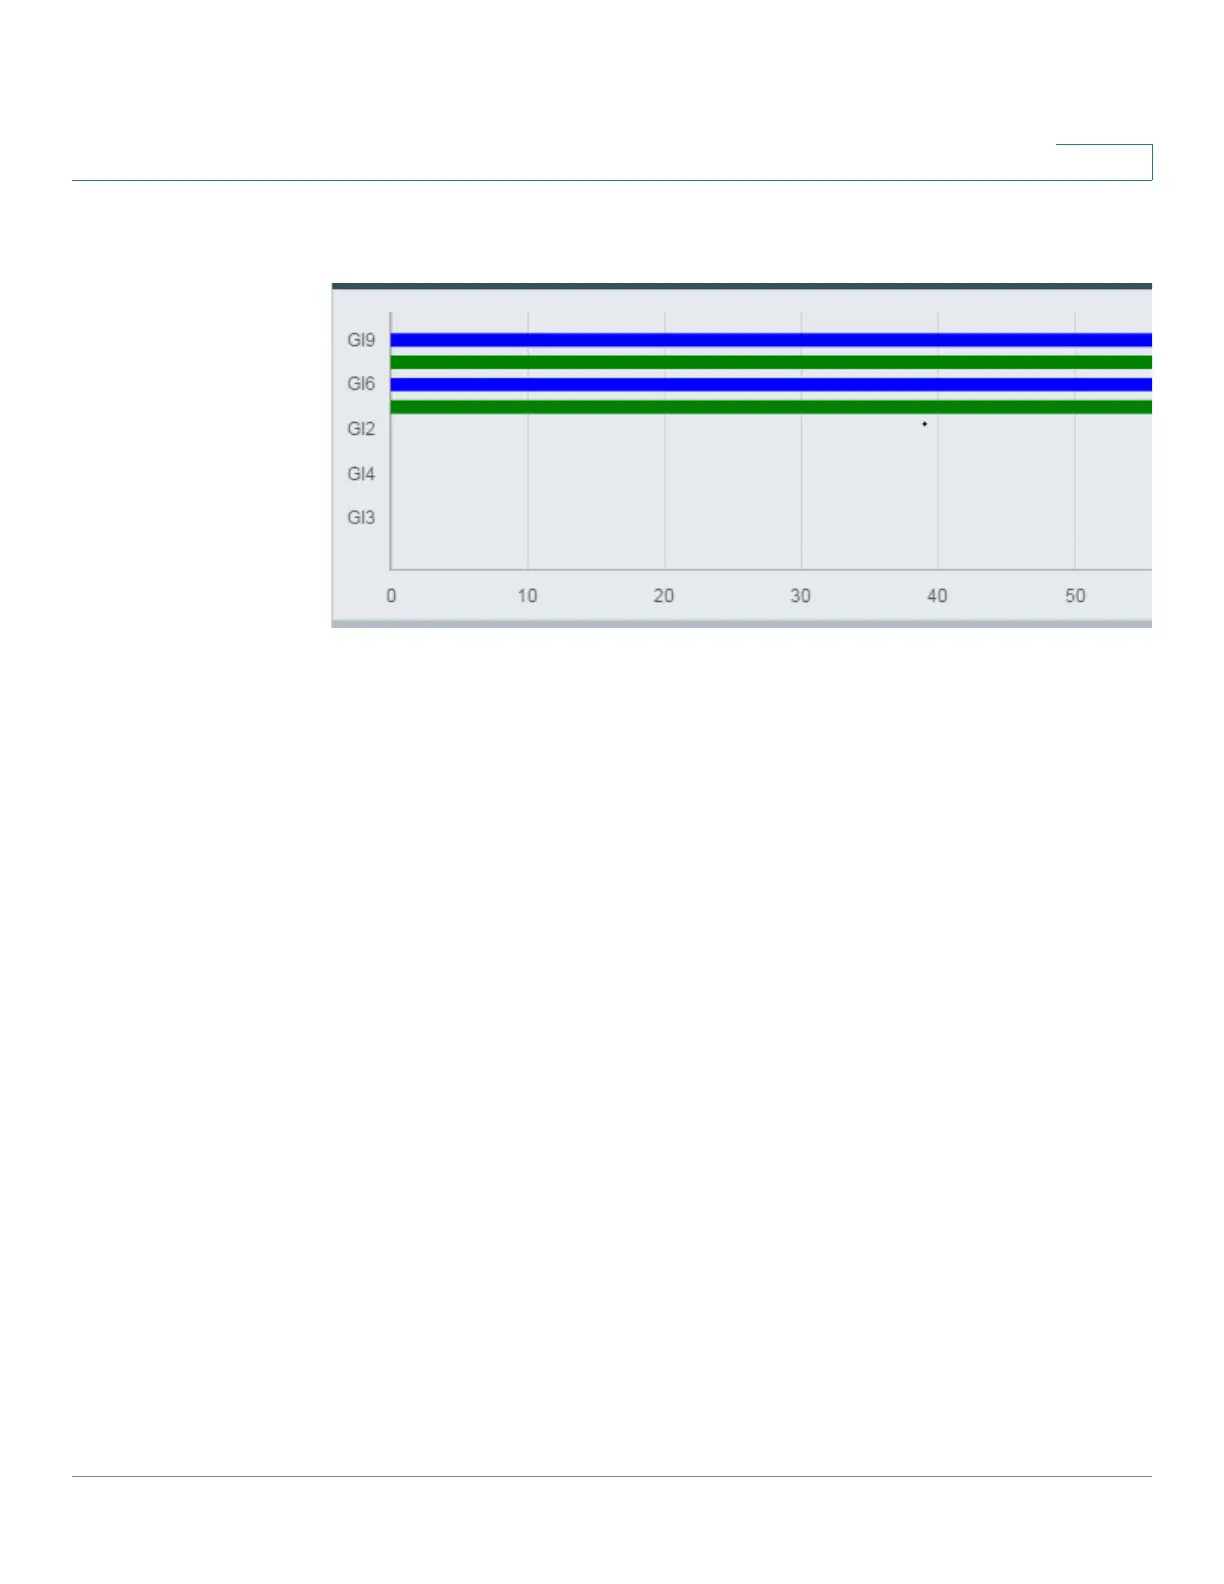
• Display Mode—Chart View
A list of ports is displayed. The port utilization is displayed in bar format:
For each port, the following port utilization information is displayed:
Tx—% (green)
Rx—% (blue)
• Refresh Time—Select one of the displayed options.
• Interface Statistics—Lick to link to the Status and Statistics -> Interface page.
 Loading...