INS_NetWave_REV– 06/10/13 PAGE 44
INSTALLATION AND OPERATION MANUAL NETWAvE
TECH SUPPORT: 1.888.678.9427
11.3.2 Spectrum: Interference Analyzer
For a radio in AP mode, clicking the Spectrum button would bring up the Channel Scan Report.
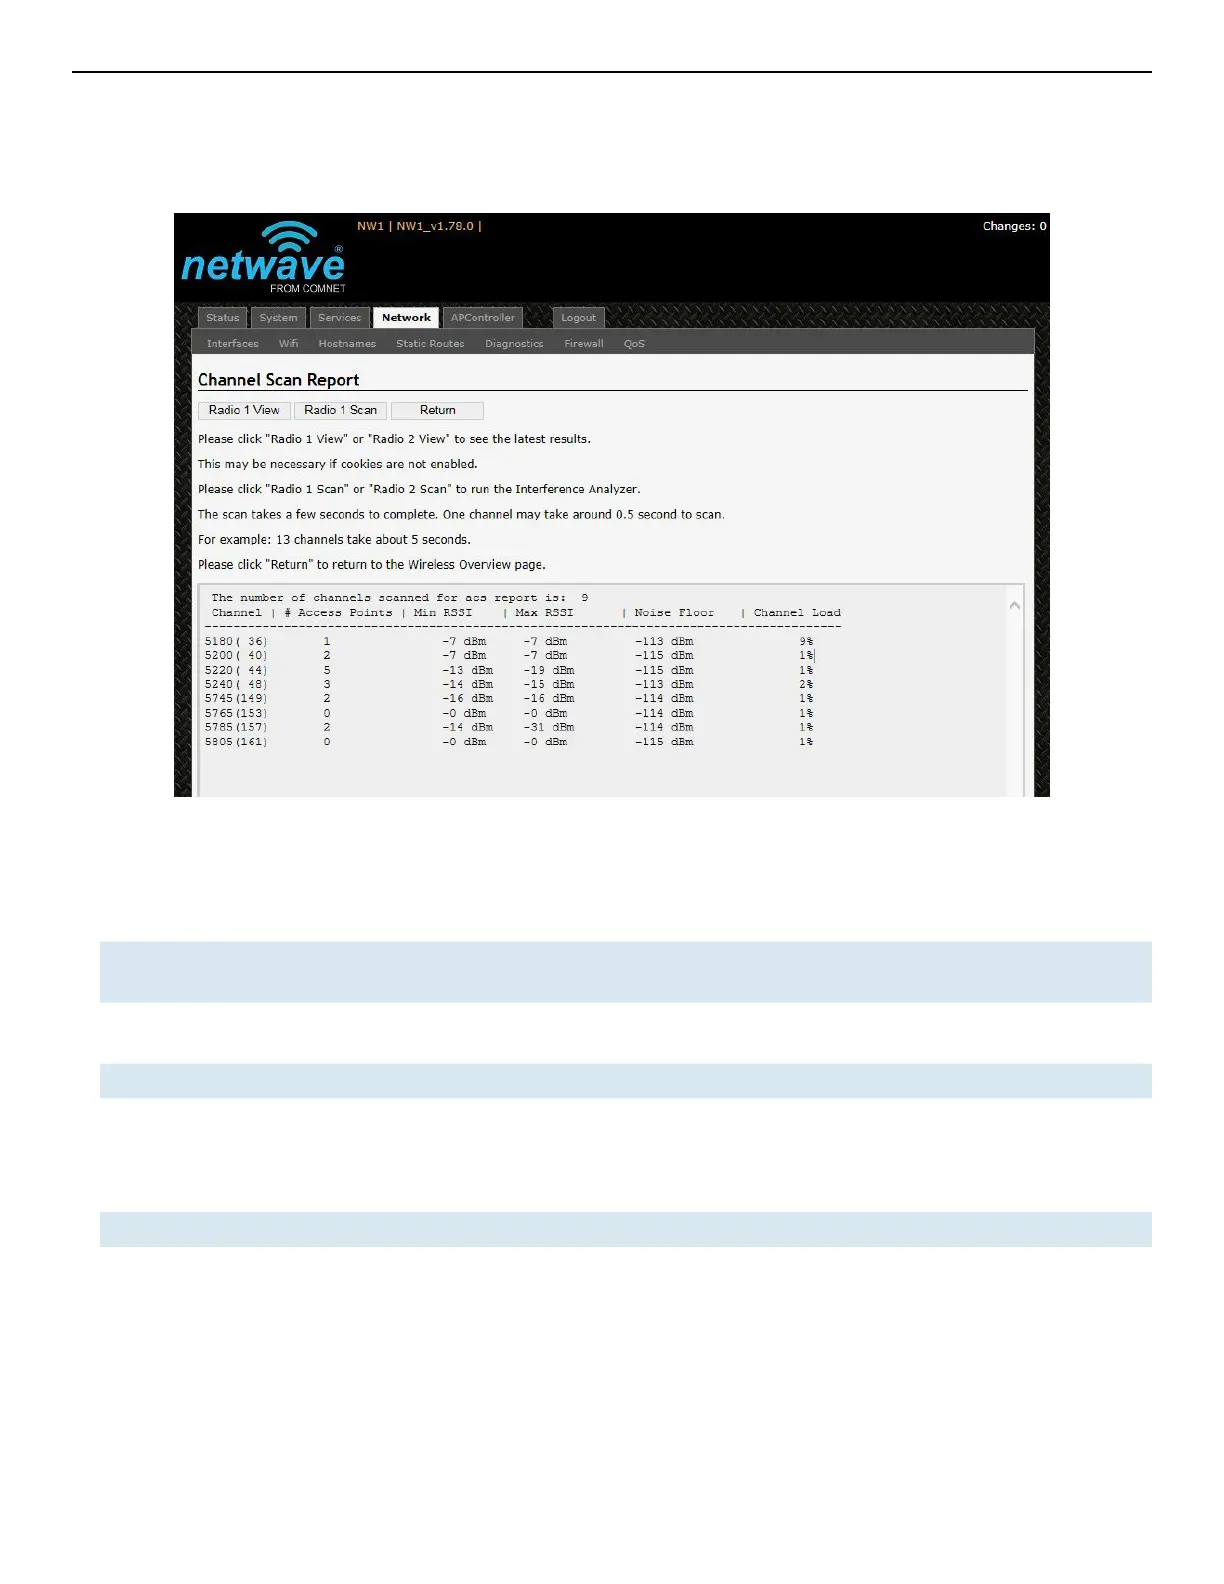
Figure 38: The Channel Scan Report.
The button 'Radio 1 View' shows the number of neighboring access points for each channel, the
Min RSSI, Max RSSI, Noise Floor, and Channel Load.
Min RSSI Shows the minimum received signal strength indicator due to the neighboring access
points.
Max RSSI Shows the maximum received signal strength indicator due to the neighboring access
points.
Noise Floor Shows the level of the noise on the channel.
Channel Load Shows how much the channel is utilized. A lower channel load denotes a channel with
less interference.
You can click 'Radio 1 Scan' to do the full channel scan again and get the latest results.
The buttons for Radio 2 would be shown if Radio 2 is enabled on the device.
Return Brings you back to the Wireless Overview page.