21
View Trap: The Trap function can receive the events that happen
from the Web Management Switch in the Monitor List.
There is a light indicator behind the “View Trap” button, when the
light indicates in green, it means that there is no trap transmitted, and
else when it indicates in red, it means that there is new trap
transmitted, this is to remind us to view the trap. (Figure 8)
Figure 8.
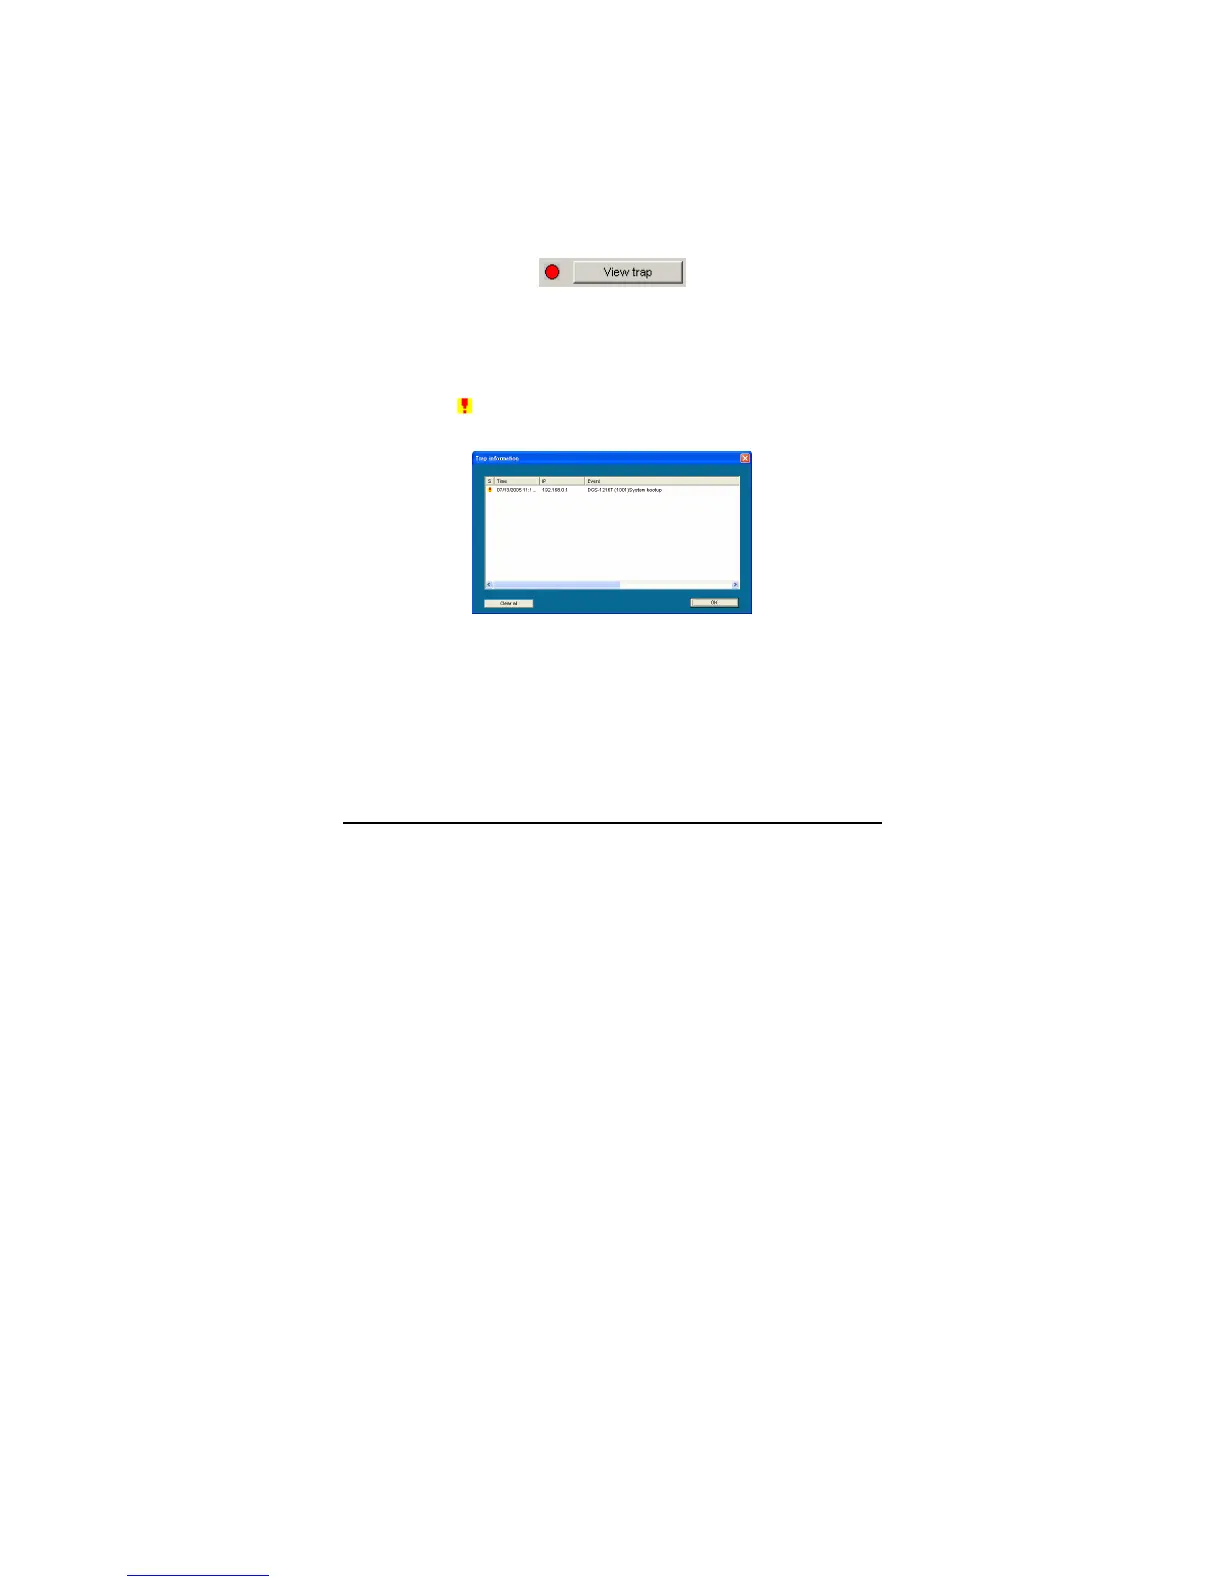
When the “View Trap” button is clicked, a Trap Information window
will pop out, it will show the trap information including the Symbol,
Time, Device IP and the Event occured. (Figure 9)
The symbol “
” represents the trap signal arise, this symbol will
disappear after you review and click on the event record.
Figure 9. Trap information
Note: In order to receive Trap information, switch has to be configured with
Trap IP and Trap Events in Web browser, which are available in the Trap
Setting Menu (see Page 44 for detail).
Add Item: To add a device to the Monitor List manually, enter the IP
Address of the device that you want to monitor.
Delete Item: To delete the device in the Monitor List.
 Loading...