

R
ramirezkyleAug 1, 2025
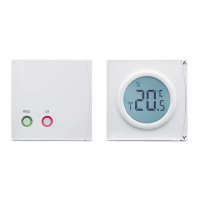
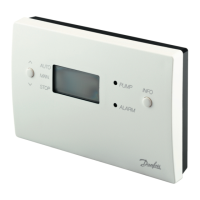
How to fix a Danfoss SH-E01 with no display?
- EEvelyn GomezAug 1, 2025
If there is no display, it could be due to the 230V supply being off. Check the supply and connections.
How to fix a Danfoss SH-E01 with no display?
If there is no display, it could be due to the 230V supply being off. Check the supply and connections.
What to do if the red LED is lit and the tank temperature is greater than 95°C on my Danfoss Thermostat?
If the red LED is lit and the tank temperature exceeds 95°C, it indicates that the pump is either not running or cannot keep up. You should check the pump mode and connections and set the speed higher.
What to do if there is no alarm and the temperature flashes on my Danfoss SH-E01?
If there is no alarm and the temperature flashes, it means the pump runs but indicates high temperature or the pump does not run. You should set the speed higher, or the pump or pump output may be defective.
What does it mean if the red LED is lit and the display flashes F1 on my Danfoss SH-E01?
If the red LED is lit and the display flashes F1, this indicates a fault at sensor 1 (Collector). Check the connections and the sensor.
Why is the red LED lit and the display flashing F2 on my Danfoss SH-E01 Thermostat?
If the red LED is lit and the display flashes F2, it indicates a fault at sensor 2 (Tank). You should check the connections and the sensor.
The regulator controls heat from the solar collector to the water tank and manages the pump via temperature sensors.
Explains how to view temperatures or solar heat output by using the INFO button on the regulator display.
Details how the regulator retains solar heat output and pump settings for 24 hours after a power interruption.
Describes the automatic pump operation to cool the hot-water tank when its temperature exceeds 90°C.
Explains how to interpret red LED and flashing codes (F1/F2) indicating sensor or tank temperature faults.
Defines the performance metric for the solar heat installation, calculated based on temperature differences and pump run time.
Presents a graph showing expected monthly solar heat output for different regions across Europe.
Discusses how system performance relates to hot water usage and the availability of free solar heat.
| Brand | Danfoss |
|---|---|
| Model | SH-E01 |
| Category | Thermostat |
| Language | English |