Stand-by
SOC: 36%
U:50.50V
I:-58.02A
Power: -2930W
Temp:30.0C
Batt
Li-BMS
Mean Voltage:50.34V Charging Voltage :53.2V
Total Current:55.00A Discharging Voltage :47.0V
Mean Temp :23.5C Charging current :50A
Total SOC :38% Discharging current :25A
Sum
Data
Details
Data
Dump Energy:57Ah
Li-BMS
Volt
1
2
3
50.38V 19.70A 30.6C 52.0% 26.0Ah 0.0V 0.0A 0|0|0
50.33V 19.10A 31.0C 51.0% 25.5Ah 53.2V 25.0A 0|0|0
50.30V 16.90A 30.2C 12.0% 6.0Ah 53.2V 25.0A 0|0|0
4
5
0.00V 0.00A 0.0C 0.0% 0.0Ah 0.0V 0.0A 0|0|0
0.00V 0.00A 0.0C 0.0% 0.0Ah 0.0V 0.0A 0|0|0
0.00V 0.00A 0.0C 0.0% 0.0Ah 0.0V 0.0A 0|0|0
0.00V 0.00A 0.0C 0.0% 0.0Ah 0.0V 0.0A 0|0|0
0.00V 0.00A 0.0C 0.0% 0.0Ah 0.0V 0.0A 0|0|0
0.00V 0.00A 0.0C 0.0% 0.0Ah 0.0V 0.0A 0|0|0
0.00V 0.00A 0.0C 0.0% 0.0Ah 0.0V 0.0A 0|0|0
0.00V 0.00A 0.0C 0.0% 0.0Ah 0.0V 0.0A 0|0|0
0.00V 0.00A 0.0C 0.0% 0.0Ah 0.0V 0.0A 0|0|0
0.00V 0.00A 0.0C 0.0% 0.0Ah 0.0V 0.0A 0|0|0
0.00V 0.00A 0.0C 0.0% 0.0Ah 0.0V 0.0A 0|0|0
0.00V 0.00A 0.0C 0.0% 0.0Ah 0.0V 0.0A 0|0|0
6
7
8
9
10
11
12
13
14
15
Curr
Volt Curr
Temp SOC Energy
Charge
Fault
Sum
Data
Details
Data
Li-BMS
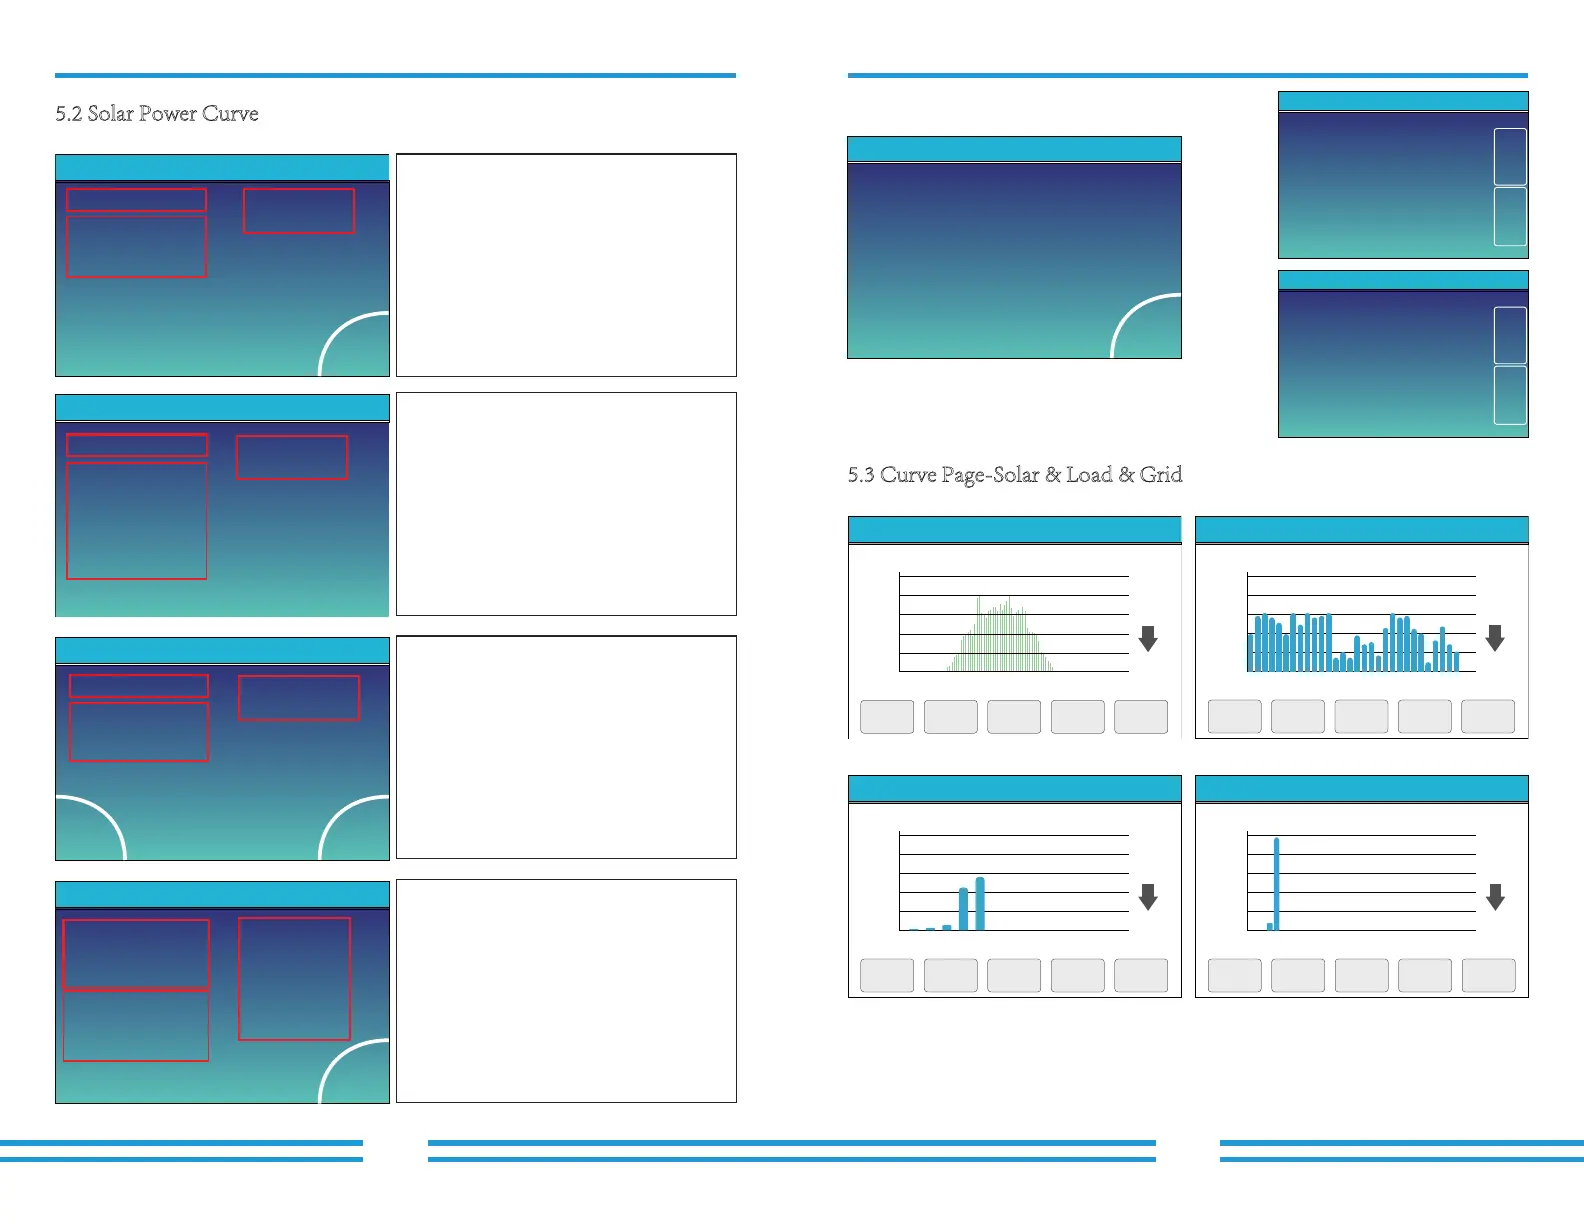
Solar power curve for daily,monthly,yearly and total can be roughly checked on the LCD,
For more accuracy power generation,pls check on the monitoring system.Click the up and
down arrow to check power curve of different period.
2019-5-28
20%
1 3 5 7 9 11 13 15 17 19 21 23
40%
60%
80%
100%
3000W
Solar Power Production:Day
CANCEL Day Month Year Tota l
5-2019
400
0
05 10 15 20 25 30
800
1200
1600
2000
2000Wh
System Solar Power:Month
CANCEL Day Month Year Total
2019
40
123456789101112
80
120
160
200
KWh
System Solar Power:Year
CANCEL Day Month Year Tota l
Tot al
400
0
20 20 2020 20 20 20 2020 20 20 20 2020 20 20 20
16 18 20 22 2426 28 30 32 3436 38 40 42 4446 48
800
1200
1600
2000
2000KWh
CANCEL Day Month Year Total
System Grid Power:Total
5.3 Curve Page-Solar & Load & Grid
This is Battery detail page.
if you use Lithium Battery,you can enter BMS page.
Power: 42W Today=0.0 KWH
Total =0.80 KWHL1: 240V L2: 0V
P1: 0W P2: 0W
Load
EnergyForced
Power: 0W
Stand-by
0.0Hz
Energy
CT1: 0W
L1: 0V L2: 0V
BUY
Today=0.0KWH
Total =8.60 KWH
Today=2.2KWH
Total =11.60 KWH
SELL
LD1: 0W
CT2: 0W
LD2: 0W
Grid
ʏ
ʐ
ʏ
ʐ
5.2 Solar Power Curve
Power: 1560W
Energy
PV1-V: 286V PV2-V: 45V
Today=8.0 KWH
Total =12.00 KWH
PV1-|: 5.5A PV2-|: 0.0A
P1: 1559W P2: 1W
Solar
Power: 44W DC-T:52.6C
AC-T:41.0CL1: 240V L2: 0V
l1:0.6A l2:0.0A
Power1: 0W
Power2: 0W
Inverter
This is Solar Panel detail page.
Press the “Energy “button will enter into the power
curve page.
ʑʏ
ʐ
ʑ
Solar Panel Generation.
Voltage,Current,Power for each MPPT.
Solar Panel energy for Day and Total.
This is Inverter detail page.
ʏ
ʐ
ʑ
Inverter Generation.
Voltage,Current,Power for each Phase.
DC-T:mean DC-DC temperature,
ʑ
AC-T:mean Heat-sink temperature.
This is Back-up Load detail page.
Press the “Energy “button will enter into the power
curve page.
ʏ
ʐ
ʑ
Back-up Power.
Voltage,Power for each Phase.
ʑ
ʑ
Back-up consumption for Day and Total.
Press the “Forced “button will forced open the
smart-load(While GEN PORT utilized as Smart-load
output).
This is Grid detail page.
Press the “Energy “button will enter into the power
curve page.
ʏ
ʐ
ʑ
Status,Power,Frequency.
CT1&CT2:External Current Sensor Power
BUY:Energy from Grid to Inverter,
L1&L2:Voltage for each Phase
LD1&LD2:Internal Current Sensor Power.
SELL:Energy from Inverter to Load.
ʏ
ʐ
ʏ
ʐ
- 23 - - 24 -