Starting Drobo Dashboard
Drobo Dashboard is an optional tool for monitoring and managing any Data Robotics device, such as Drobo or
DroboShare. Drobo Dashboard offers useful information and convenient tools and is required in order to update Data
Robotics devices to the most recent released versions of firmware and software.
Drobo Dashboard provides an easy to read Menu Bar icon that shows you the status of your Drobo. So if you keep your
Drobo in a location where the data bay indicators are not visible to you, you can use Drobo Dashboard to remotely
monitor the status and capacity of Drobo and DroboShare.
There are three ways to start the Drobo Dashboard:
from the Applications folder
from the Dock
from the Menu Bar
To Start Drobo Dashboard from the Applications Folder:
1. Go to your Applications folder.
2. Click on the Drobo Dashboard folder.
3. Select Drobo Dashboard to launch Drobo Dashboard.
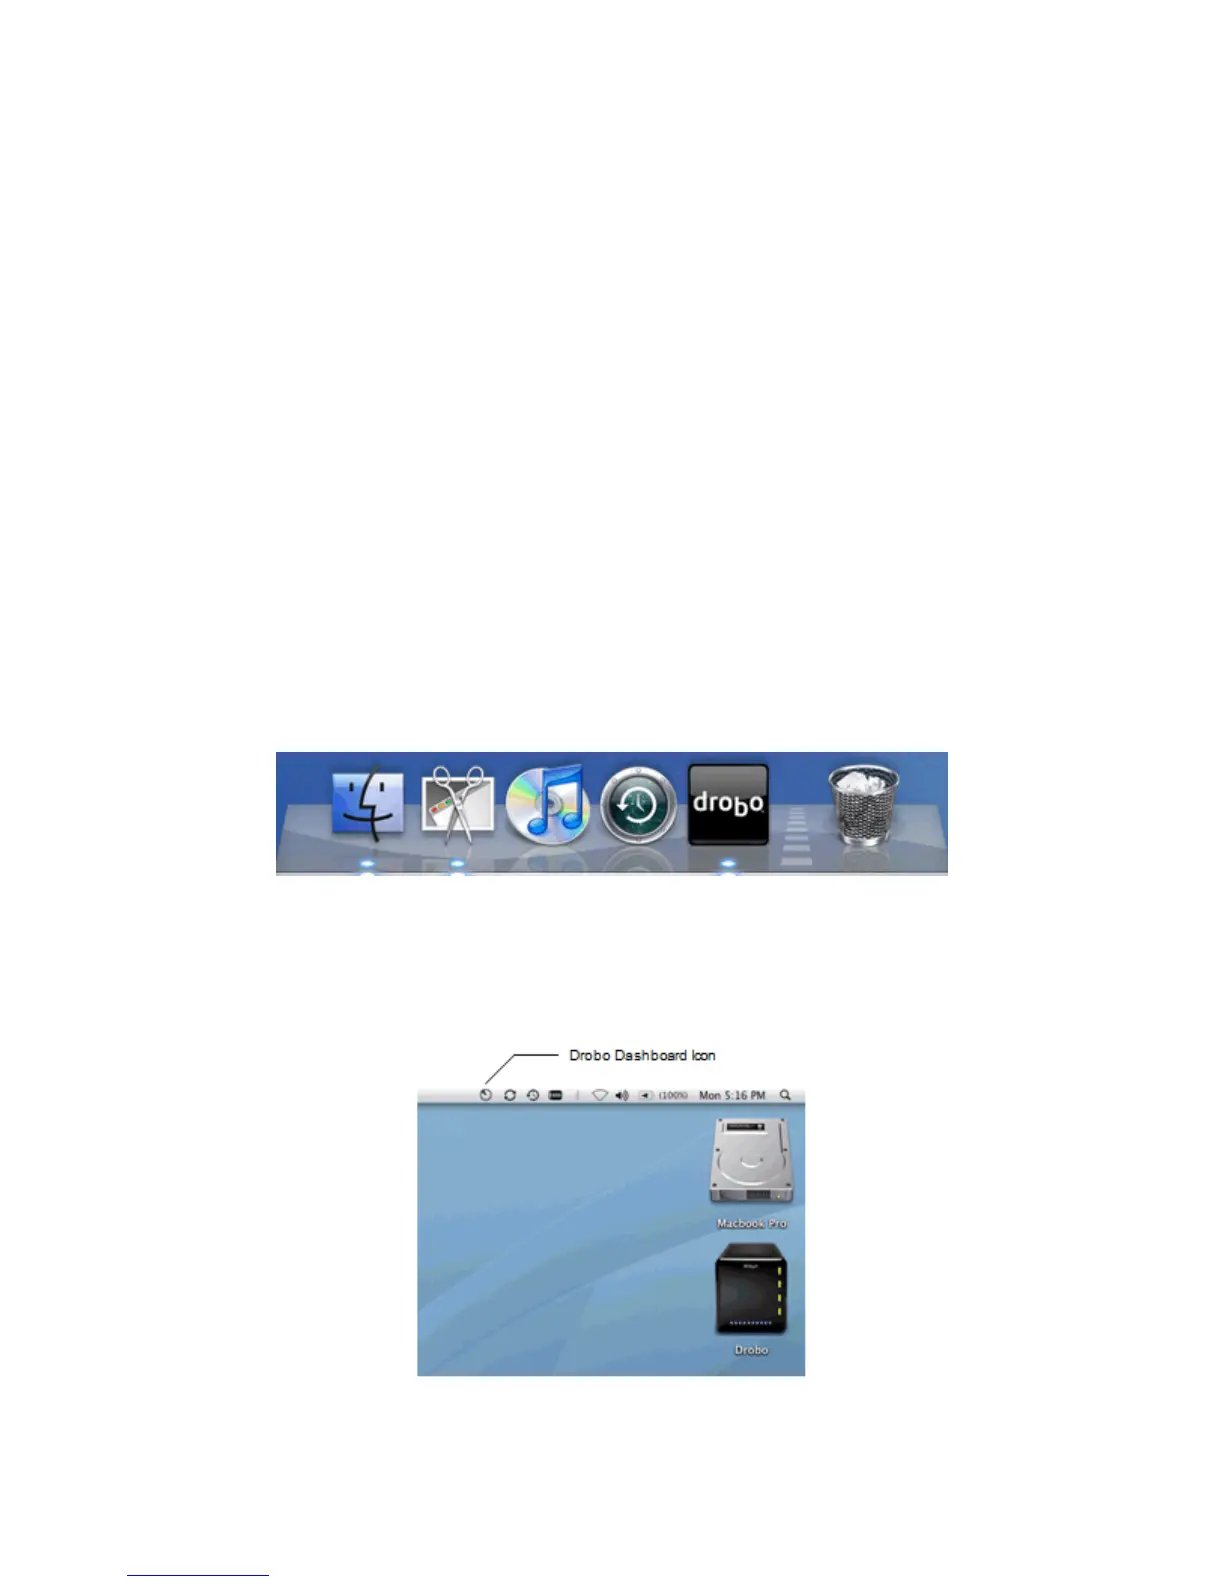
To Start Drobo Dashboard from the Dock:
1. Find the Drobo icon in your dock.
2. Click on the Drobo icon to open the Drobo Dashboard.
To Start Drobo Dashboard from the Menu Bar:
1. From the Menu Bar, double-click on the Drobo Dashboard Icon to launch Drobo Dashboard. You can also
directly access specific Drobo Dashboard windows by clicking on the Drobo Dashboard icon.
To Exit Drobo Dashboard:
25