Envent Engineering Ltd. Page 9 Revision 2.4
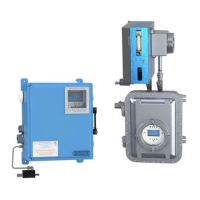
Figure 1. H
2
S Analyzer Principle of Operation Diagram
Figure 1 above shows a flow and pressure regulated of a filtered sample gas passing
through the humidifier into the sample chamber. An aperture in the sample chamber,
which differs in sizes depending on the application, allows the gas to come in contact
with the H
2
S sensing tape creating a brown stain.
Flow and pressure are the most important variables when measuring H
2
S and must
be kept at a constant state for the analyzer to measure H
2
S properly. Pressure should
be kept at a constant 15 psig. The lowest pressure found to be tolerable for proper
H
2
S measurement is 0.5 psig. Flow must be kept at a constant flow of 2 cm (83.63
cc/min). A change in flow of +/- 1 cm affects the reading by 10% of full range.
Analysis Cycles
The analysis of the color rate of change on the H
2
S sensing tape is measured in
analysis cycles. An analysis Cycle lasts up to a maximum of 720 seconds (12
minutes).
Do not change the Maximum Analysis Time, consult Envent Engineering Ltd.
Analyzers sold prior to Mid-August 2016 are set to have a 360 second analysis cycle.