48
WATER PRESSURE DROP TOTAL HEAT RECOVERY VR
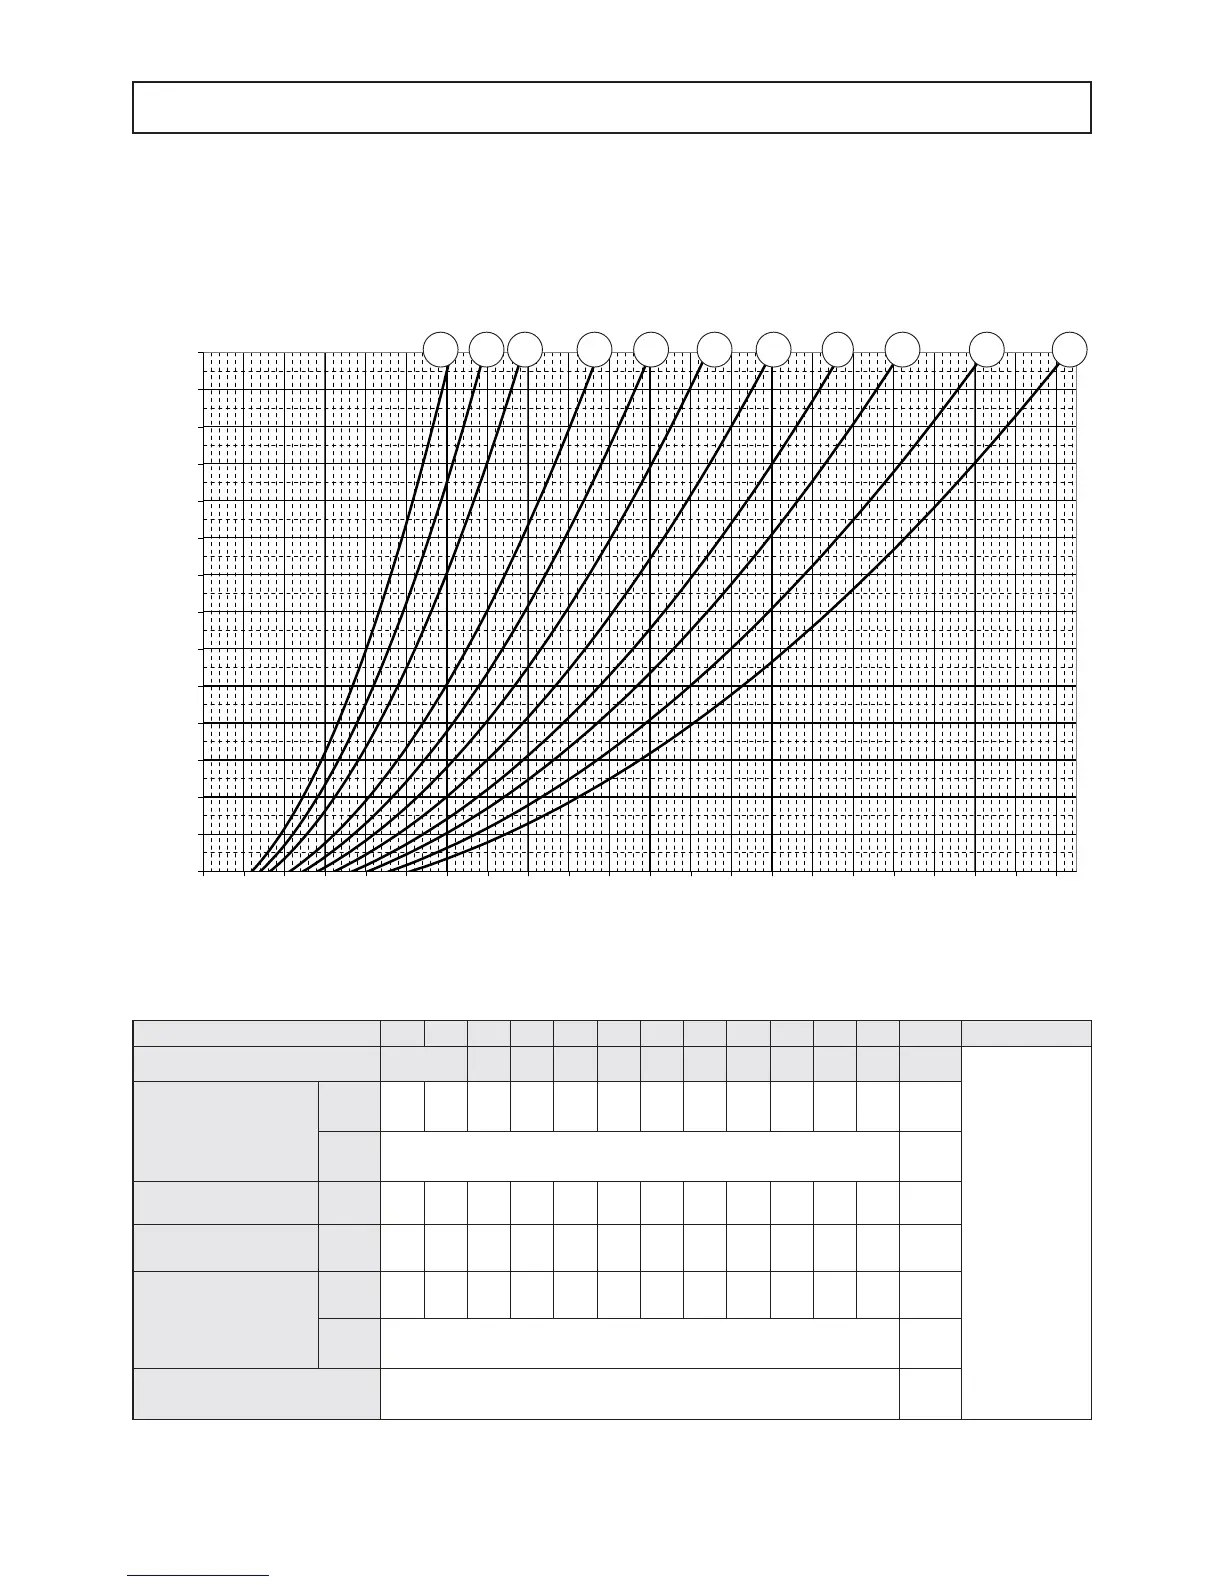
The graph below illustrates the water pressure drop values in kPa depending on the flow rate in liters/second, for the Special
Versions with Total heat recovery (VD) in both the units that operate in the Cooling mode only (IR).
The operating range is delimited by the minimum and maximum values given in the next table.
Water pressure drop (kPa)
Water flow rate (l/s)
Operation range
2 3 4 5 6 7 9
10 11
81
Unit Size
50 60 70 80 90 100 115 130 145 160 180 200
UM NOTES
Graph reference 1 2 3 4 5 6 7 8 9 10 11
Q=Water flow
rate
Δp=Water pressu-
re drop
Lower limit value
Q
1.71 1.71 1.92 2.16 2.64 2.98 3.33 3.74 4.19 4.56 5.10 5.62
l\s
Δp
10
kPa
Water flow
recovery (1)
Q
3.37 3.72 4.37 5.02 5.73 6.45 7.07 8.03 9.08 10 11.4 12.7 l/s
Pressure drop
recovery (1)
Δp
39 47 52 54 47 47 45 46 47 48 50 51 kPa
Upper limit value
Q
3.37 3.72 4.37 5.02 5.73 6.45 7.07 8.03 9.08 10 11.4 12.7
l\s
Δp
150
kPa
Max. operating
pressure on wet side
600
kPa
(1): water temperature: evaporator inlet 12°C - evaporator outlet 7°C
water temperature: recovery inlet 40°C - recovery outlet 45°C
 Loading...