Theory of thermography
36
36.3.1 Planck’s law
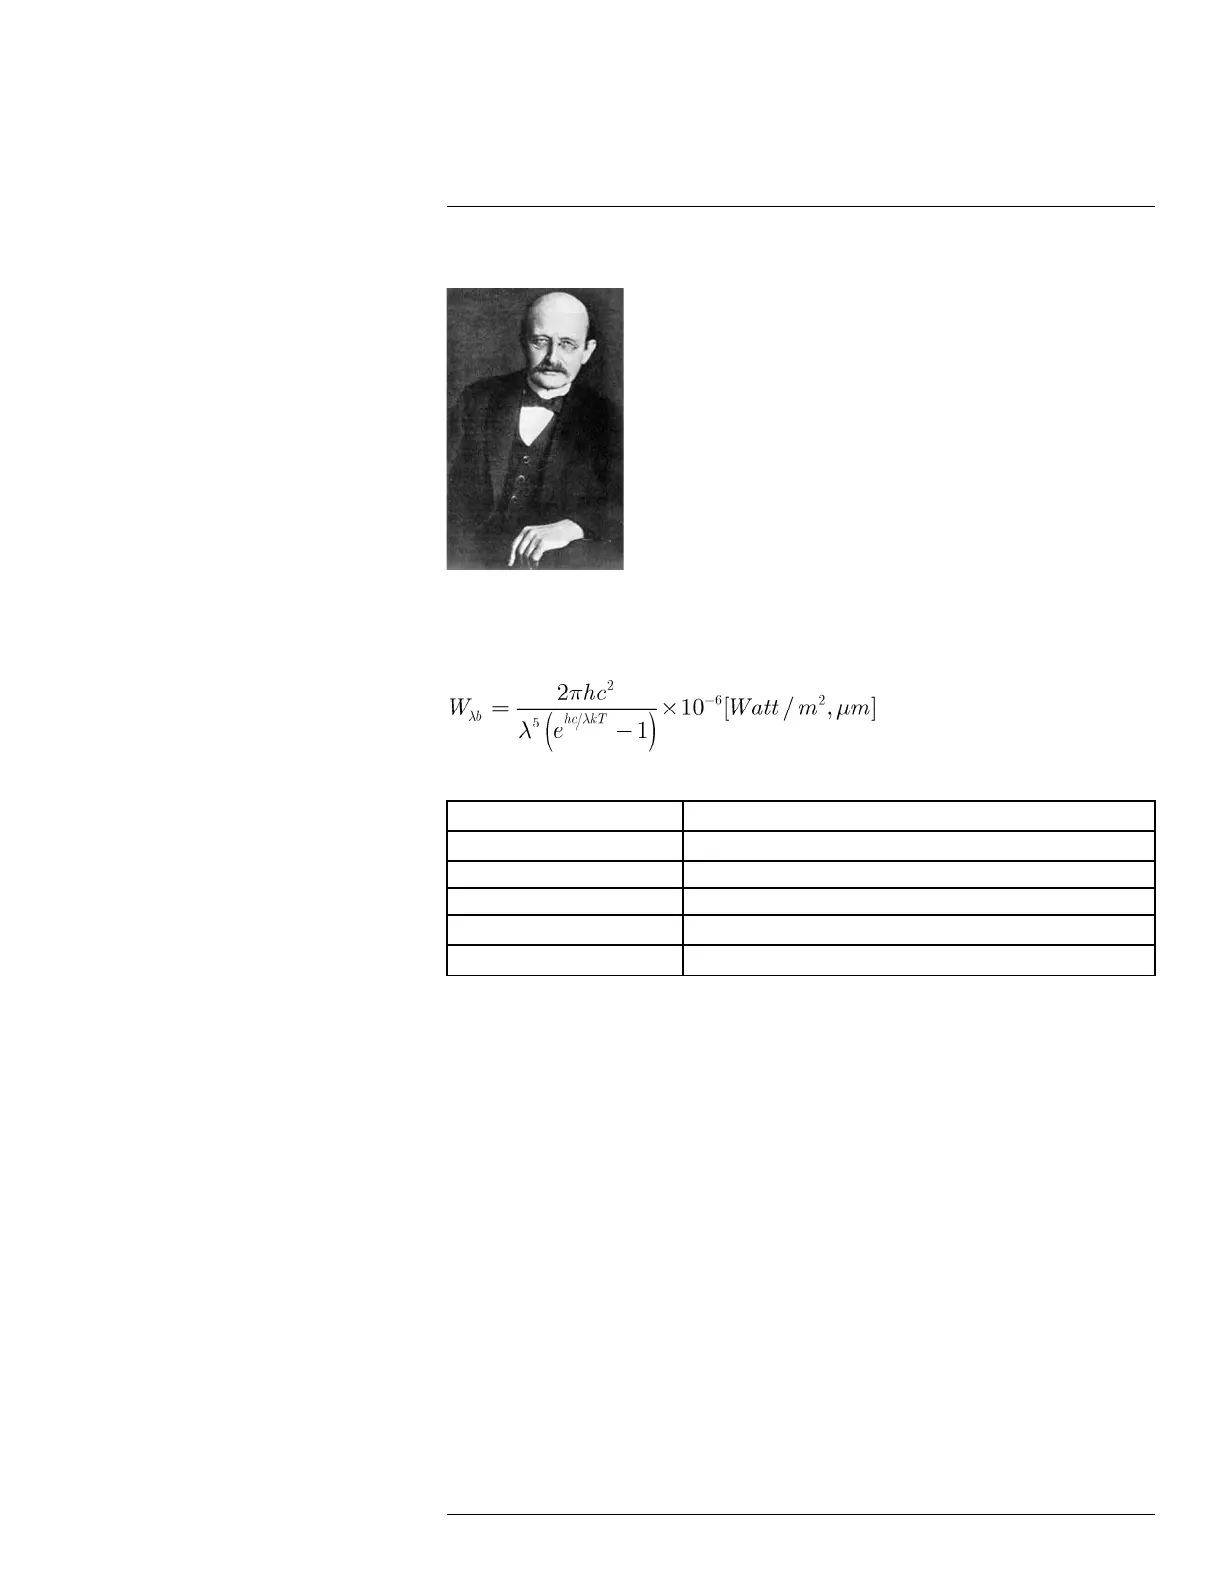
Figure 36.3 Max Planck (1858–1947)
Max Planck (1858–1947) was able to describe the spectral distribution of the radiation
from a blackbody by means of the following formula:
where:
W
λb
Blackbody spectral radiant emittance at wavelength λ.
c
Velocity of light = 3 × 10
8
m/s
h Planck’s constant = 6.6 × 10
-34
Joule sec.
k Boltzmann’s constant = 1.4 × 10
-23
Joule/K.
T Absolute temperature (K) of a blackbody.
λ Wavelength (μm).
Note The factor 10
-6
is used since spectral emittance in the curves is expressed in Watt/
m
2
, μm.
Planck’s formula, when plotted graphically for various temperatures, produces a family of
curves. Following any particular Planck curve, the spectral emittance is zero at λ = 0, then
increases rapidly to a maximum at a wavelength λ
max
and after passing it approaches zero
again at very long wavelengths. The higher the temperature, the shorter the wavelength at
which maximum occurs.
#T810190; r. AL/47698/47698; en-US
291