20
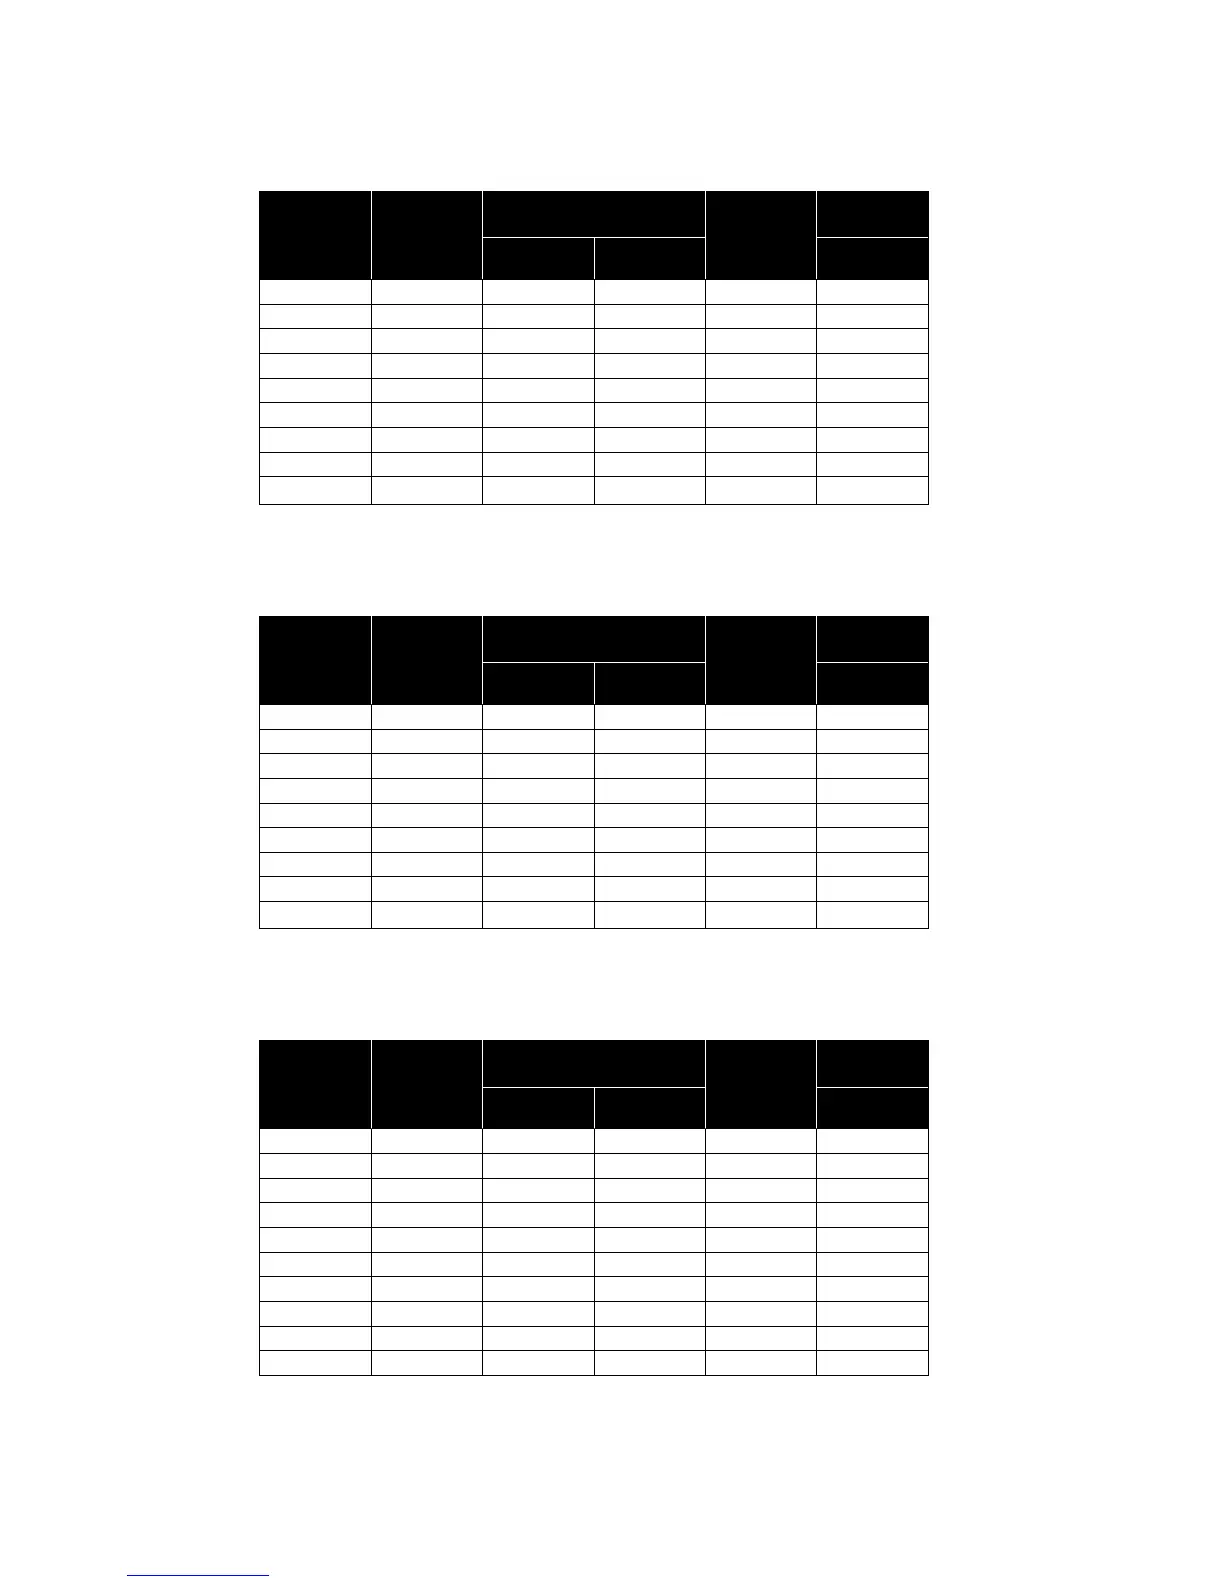
APPENDIX 2: FRICTION LOSS TABLES
Flow
gpm
Velocity
ft/s
Friction Loss, ft hd / 100'
Velocity
ft/s
Fric. Loss
ft hd / 100'
Steel (C = 100) PVC (C = 140) Copper (C = 130)
2 1.20 1.93 1.03 1.33 1.50
3 1.80 4.09 2.19 1.99 3.18
4 2.41 6.96 3.73 2.65 5.42
5 3.01 10.53 5.64 3.31 8.20
6 3.61 14.75 7.91 3.98 11.49
7 4.21 19.63 10.53 4.64 15.29
8 4.81 25.13 13.48 5.30 19.57
9 5.41 31.26 16.76 5.97 24.35
10 6.02 38.00 20.38 6.63 29.59
Flow
gpm
Velocity
ft/s
Friction Loss, ft hd / 100'
Velocity
ft/s
Fric. Loss
ft hd / 100'
Steel (C = 100) PVC (C = 140) Copper (C = 130)
4 0.86 0.57 0.30 1.02 0.53
6 1.29 1.20 0.64 1.53 1.13
8 1.72 2.04 1.10 2.04 1.92
10 2.15 3.09 1.66 2.55 2.90
12 2.57 4.33 2.32 3.06 4.07
14 3.00 5.76 3.09 3.57 5.41
16 3.43 7.38 3.96 4.08 6.93
18 3.86 9.18 4.92 4.59 8.62
20 4.29 11.16 5.98 5.11 10.48
25 5.36 16.87 9.05 6.38 15.85
Flow
gpm
Velocity
ft/s
Friction Loss, ft hd / 100'
Velocity
ft/s
Fric. Loss
ft hd / 100'
Steel (C = 100) PVC (C = 140) Copper (C = 130)
2 0.74 0.60 0.32 0.78 0.41
4 1.48 2.15 1.15 1.56 1.48
6 2.23 4.56 2.44 2.33 3.14
8 2.97 7.76 4.16 3.11 5.35
10 3.71 11.74 6.29 3.89 8.08
12 4.45 16.45 8.82 4.67 11.33
14 5.20 21.89 11.74 5.44 15.07
16 5.94 28.03 15.03 6.22 19.30
18 6.68 34.86 18.70 7.00 24.00
¾" Pipe
NOTE: Charts show friction loss per 100' of pipe. To convert to friction loss per foot, move
decimal point two places to the left.
1¼" Pipe
1" Pipe