2. CHART PLOTTER
2-25
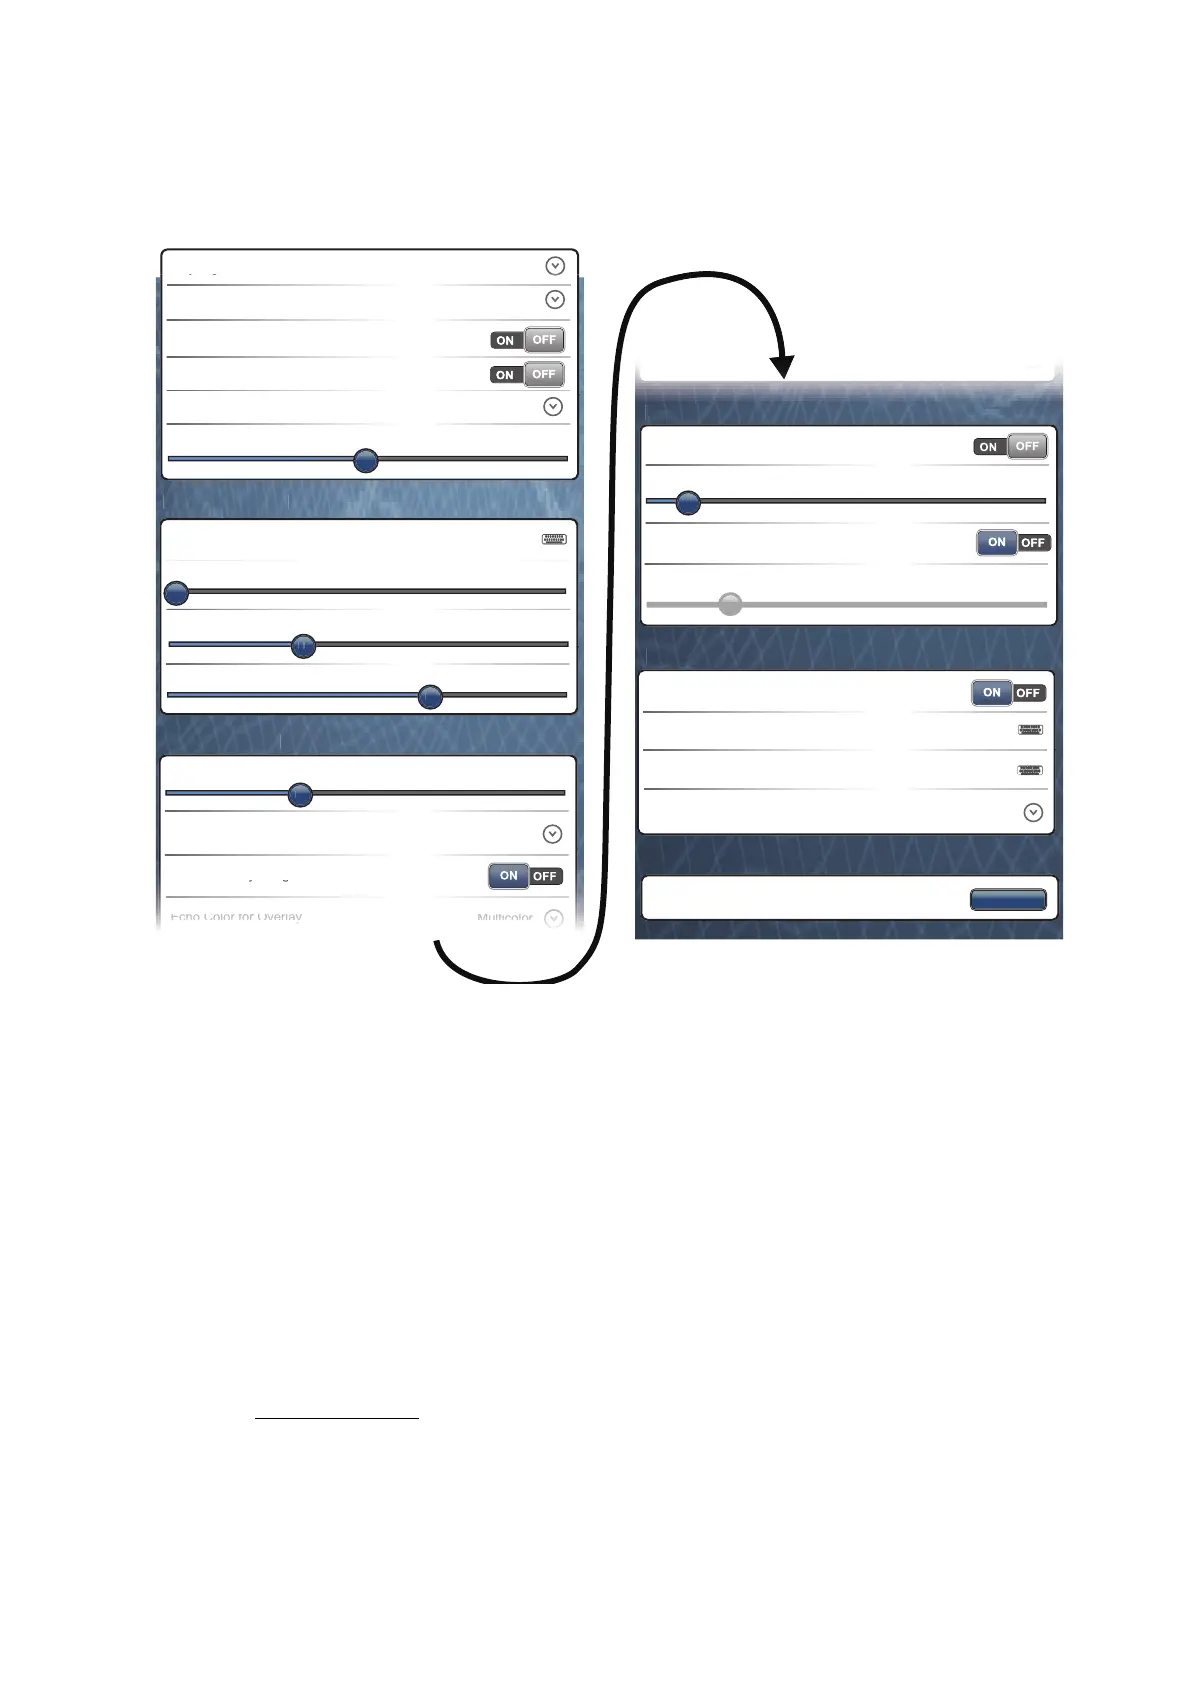
2.13 Plotter Display Menu
This section describes the chart plotter menus. To open the following menus, select
[Menu] on the menu icon bar then select [Plotter Display].
[Day/Night Mode]: Select the color mode for best viewing in the current environment.
The options are [Automatic], [Day], [Dusk] and [Night].
[Chart Priority in Auto Mode]: Select the chart priority in auto mode from [Vector] and
[Raster].
[Chart Boundaries]: Show or hide the chart boundaries.
[Display Raster Chart Unit Legend]: Show or hide the [Raster chart unit] box at the bot-
tom left-hand corner of the screen. The unit for the depth values on the raster chart is
displayed in the [Raster chart unit] box.
[Grid Interval]: Select the grid interval on the plotter display. The options are [Off],
[Very Low], [Low], [Medium], [High] and [Very High].
[Tide/Current Icons Size]: Set the size of the icon for tide and current.
[Transparencies]
[Tide Range for PhotoFusion]: Set the tide range to show in the satellite photo overlay.
See paragraph 3.2.2.
[PhotoFusion Transparency Offset]: Set the degree of transparency for the satellite
photo overlay. See paragraph 3.2.2.
a
/Ni
ht Mode
ay
00
hart Boundaries
isplay Raster
hart Unit Legent
rid Interval
ide
urrent Icons
ize
hotoFusion Transparency Offset
0
Tidal
urrents Transparency
epth
hading Transparenc
Radar Overlay Transparenc
adar Overlay Source
ff
ransparencies
adar Overla
ntenna Range
D Alti Exaggeratio
D Bathy Exaggeration
uto Depth Shading Color Scale
n
mum
a
ue
ax
mum
a
ue
Depth Color Shade
sp
ay
Depth
hading Value
eset De
ault
ettings
.
f
2
lassicHue
uto
D Alti Exaggeration
uto
D Bathy Exaggeratio
10
Chart Priority in Auto Mode
Raster
Tide Range for PhotoFusion
12.0 ft
 Loading...