APPENDIX A
A-2
Assuming full load=100% of CT, the 15.34% unbalance
now becomes:
.
. %
1 0 5
15 34
×
×
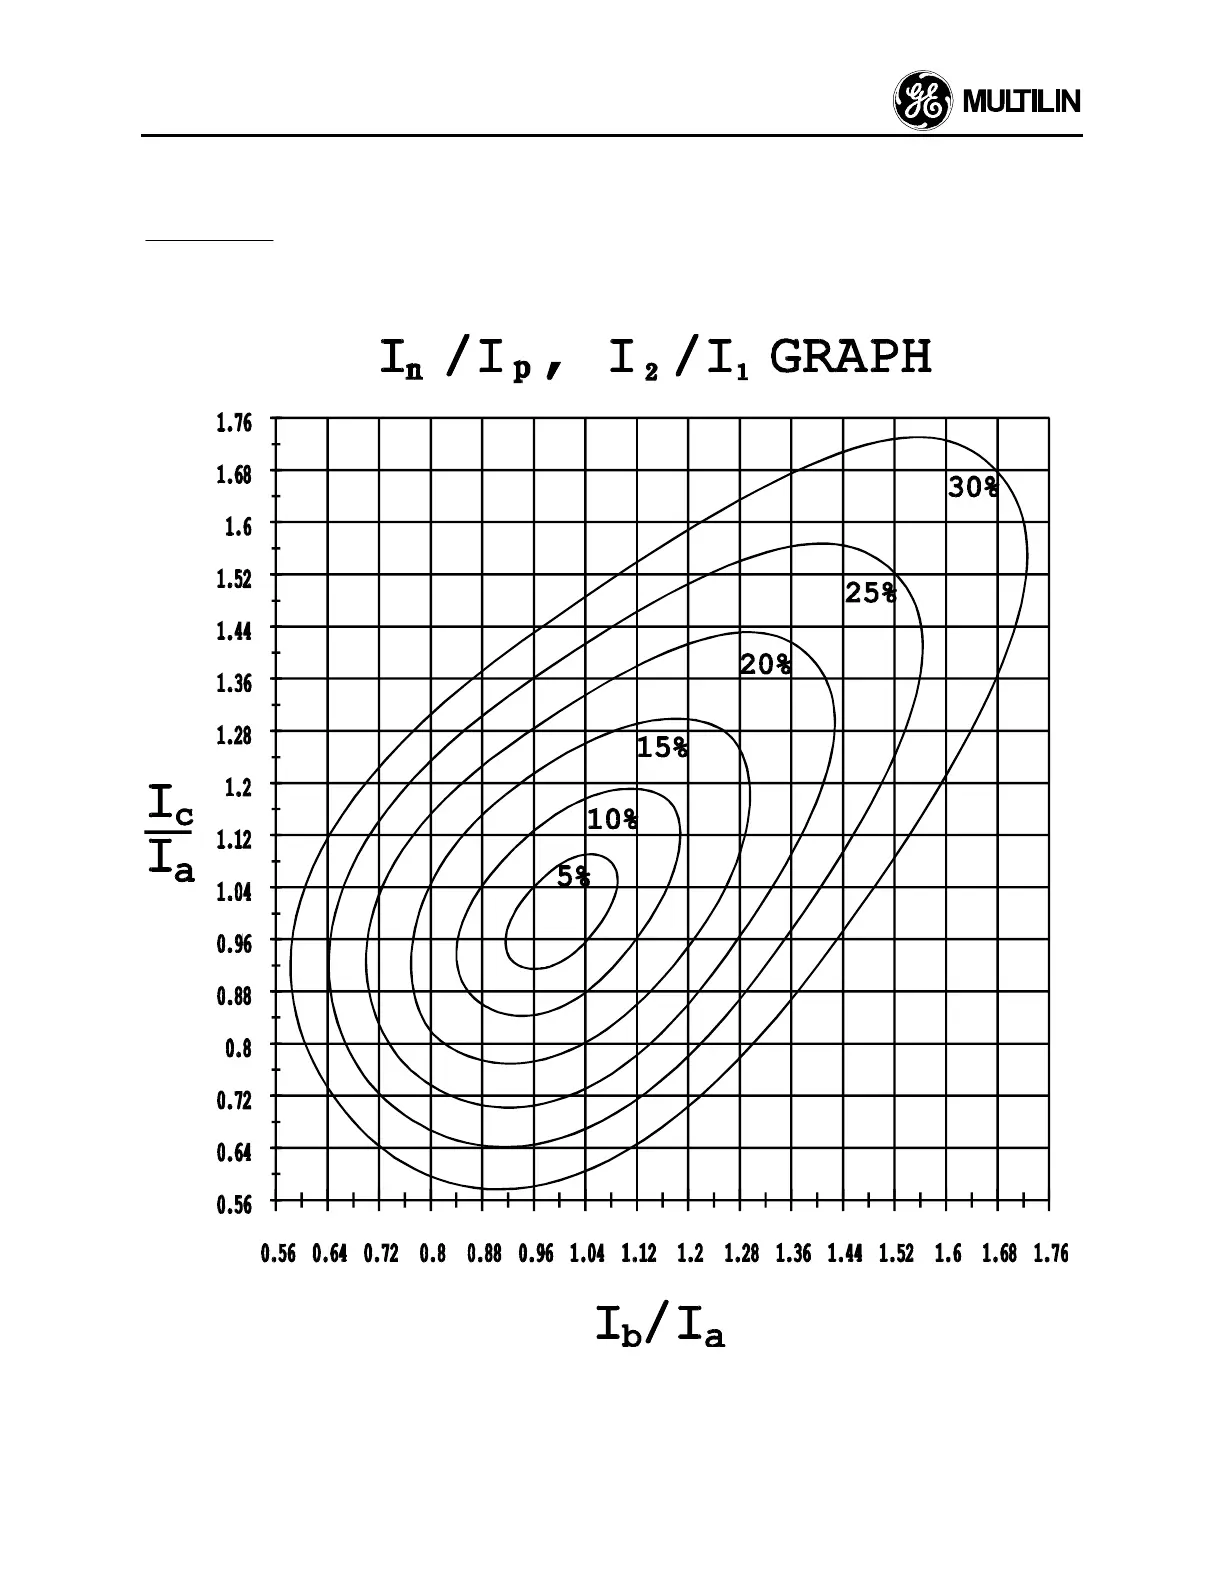
Finally, the ratio of negative sequence to positive se-
quence current for any magnitude of phase current may
be displayed on a graph as shown in Fig.3 (providing
the supply is a true three phase supply and there is no
zero sequence current flowing, no ground fault).
Figure 3
 Loading...