Commander III
2-42
Setup menu
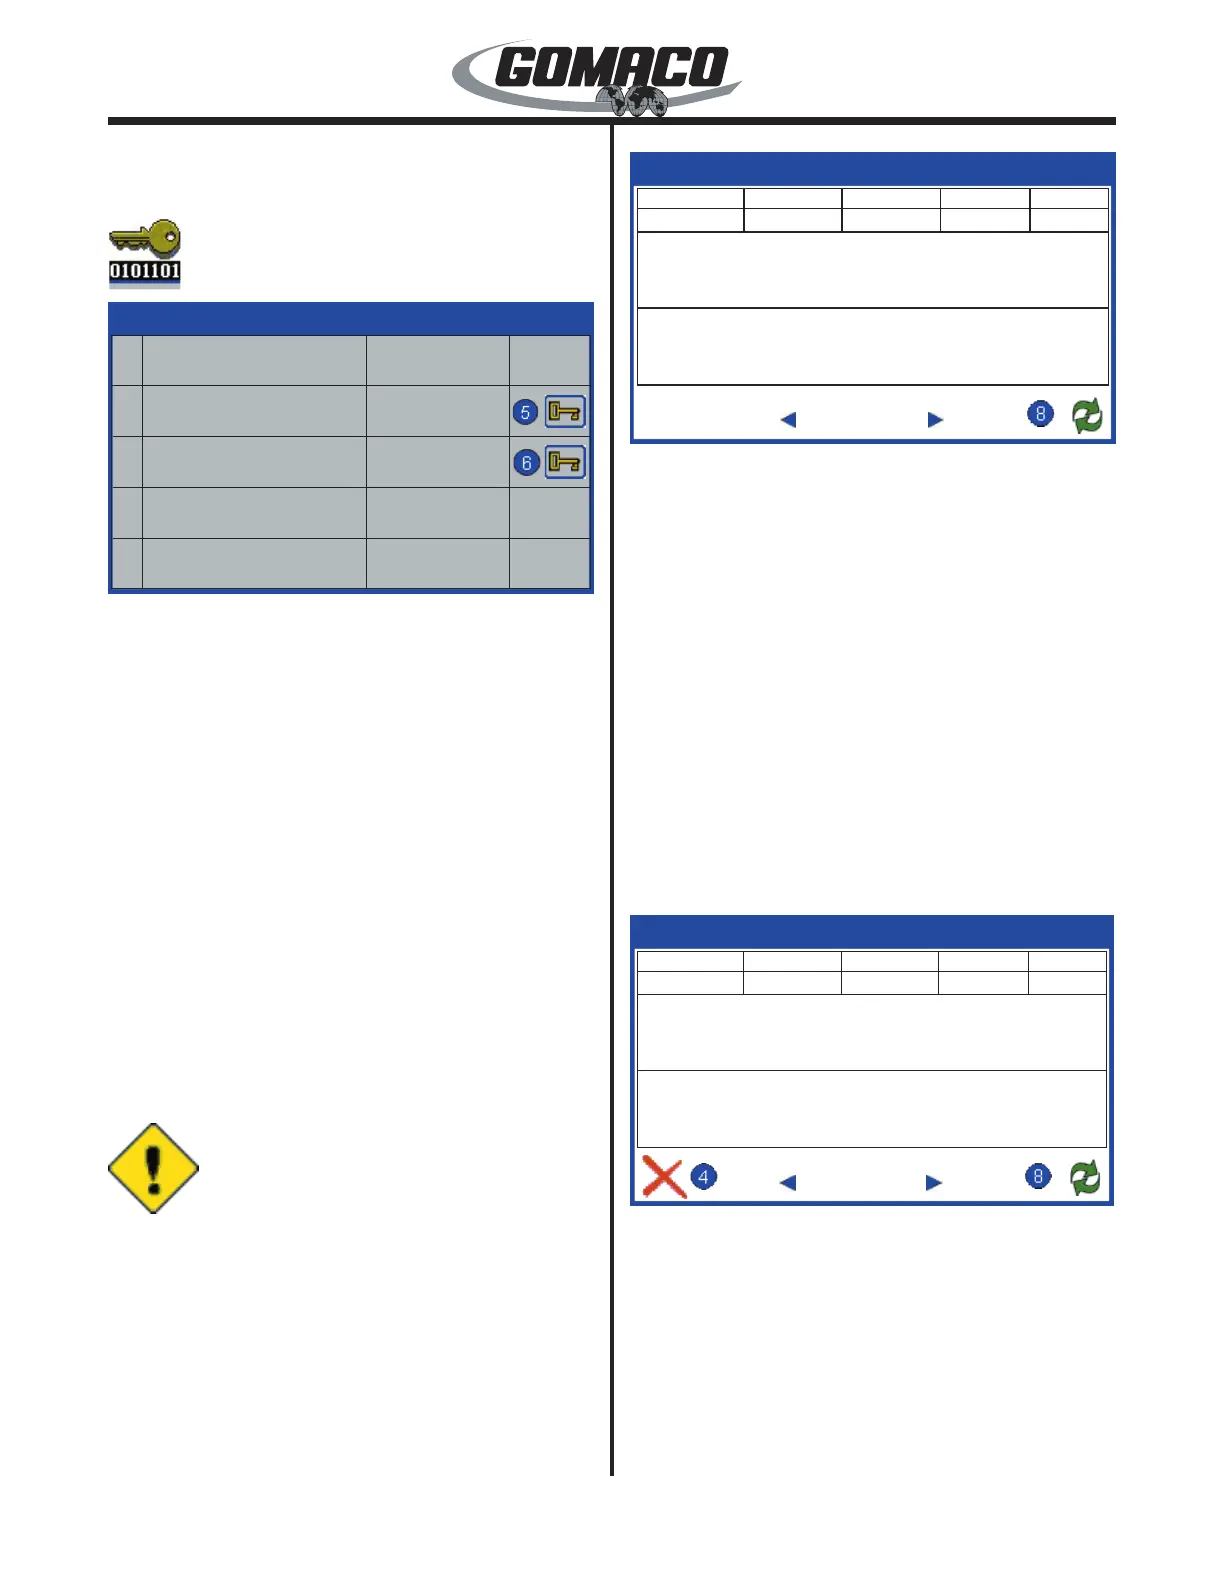
Feature Encryption
030
149G+
# Feature Name S/N Status
1 3D Control 5D-D4-CF-39
2 STC 9F-53-55-9C
3
4
149G+
Used to view the status of optional controls for the
machine, such as 3D control shown above. The
name, serial number and status are indicated for each
option added to the machine. A green check mark
icon in the status column will indicate that the feature
is activated. A number button with a key icon in the
status column indicates that the feature requires a
key code for activation. Press the number button
indicated in the data box to activate the feature using
the edit display (see edit display description earlier).
GOMACO provides a key code for entry on the edit
display to activate additional features. Added features
may include additional displays or data boxes as well
as fault codes required for assessory operation. The
serial number following the feature name is required
to generate the key code. Contact GOMACO for more
information on additional features.
Main menu
Active faults
008
The active faults display shows faults detected by the
G+ controller. From the main menu display, press the
navigation buttons to move the red selection cursor
to the Fault menu icon (#4). Press the OK button to
enter the active Fault display screen (or press the
number 4 button to bypass cursor navigation and
directly enter the active Fault display screen). Press
the escape button (ESC) to return to the Main menu.
146G+
1 of 1
ID
Status
Count
SA
0024
09
126
0x11
Active Faults
Left Front Elevation Sensor
Value out of range
146G+
Sensor voltage <1.4V or >3.6V
▼
The active faults display shows current faults in the G+
controller. The top two lines of the active fault show
fault status information. The “ID” and “Status” columns
show the identication numbers of the messages
in the middle box. The “Count” column shows the
number of times the same fault has occurred since
the fault history was last cleared. The “SA” column
shows the CAN address for the controller which is
the source of the displayed fault message. Press
the down navigation button (▼) in the active faults
display to move to the fault history display. The fault
history display shows current and past faults in the
G+ controller. Press the up navigation button (▲) in
the fault history display to return to the active faults
display. Press the escape button (ESC) to return to
the main menu from either fault display (or to return
to the run menu if the fault history displays were
accessed from there).
147G+
30 of 30
ID
Status
Date
Time
0015
26
11/14/12
10:34:11
Fault History
Console E-Stop
Warning
147G+
E-Stop switch engaged
▲
The top two lines of the fault history show fault status
information. The “ID” and “Status” columns show the
identication numbers of the messages in the middle
box. The “Date” column shows the date that the fault
occurred. The “Time” column shows the time of day
that the fault occurred.
The middle box on each display shows the current
fault being viewed. The bottom box contains a
description of the fault. The bottom line (“30 of 30”
 Loading...