41
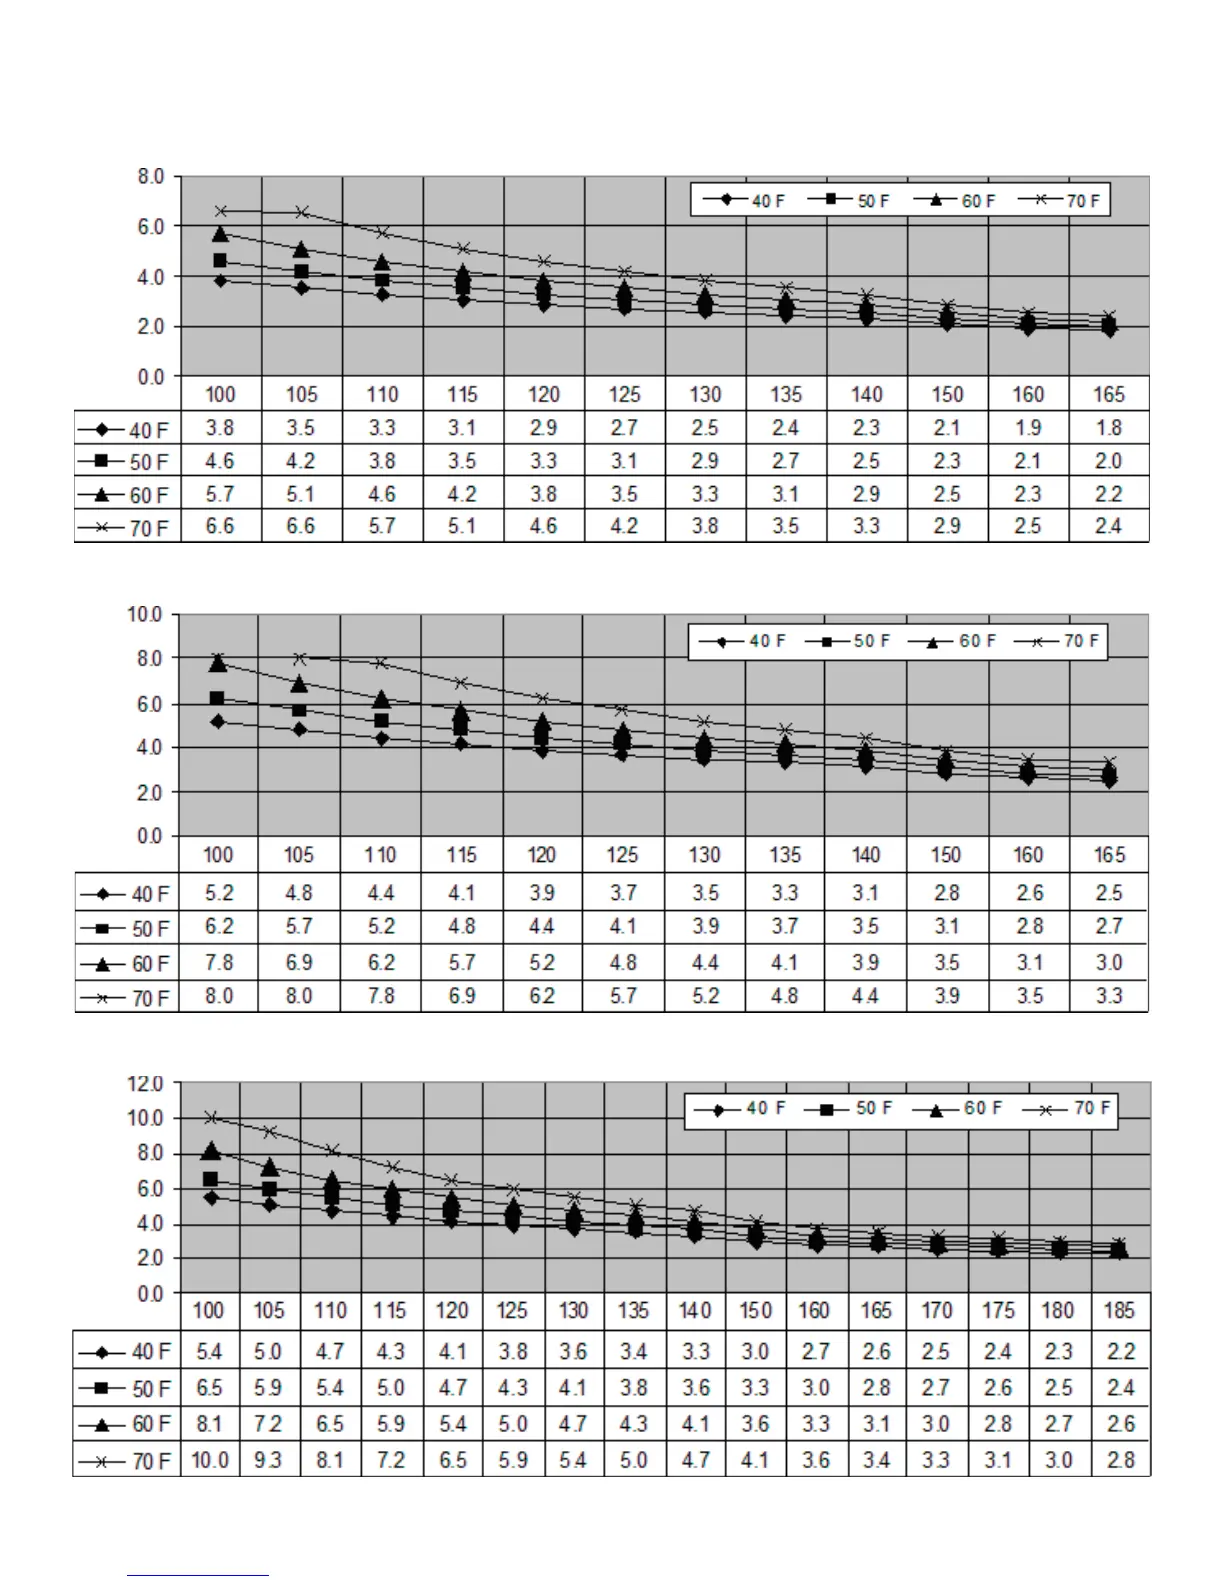
OUTPUT TEMPERATURE CHART
Chart is based on properly sizes gas line
110 Models
Output Temperature vs. GPM (Max. 6.6 GPM) with Various Inlet Water Temperature
Output Hot Water GPM
310 Models
Output Temperature vs. GPM (Max. 8.0 GPM) with Various Inlet Water Temperature
Output Hot Water GPM
510 Models
Output Temperature vs. GPM (Max. 10.0 GPM) with Various Inlet Water Temperature
Output Hot Water GPM
*When the set temperature is 55°C (131°F) or higher, maximum flow rate is limited to 8.0 GPM.