15
4.2.2.1 Measure (measurement array)
In this menu you can measure within the previously created and selected measurement
array. Pushing the button <ENTER> starts the measurement. Depending on the value in
preferences item “average” the end value will be displayed only after repeatedly pushing
the <ENTER>-Button. (Default setting for averaging = 1)
The displayed value will be stored automatically and the next coordinate will be given.
Below the measurement value you can see the coordinate of the next measurement in
the grid (row-column).
With the help oft the key <PROCEED> you can add a void measurement point, e. g. to
exclude a smokestack or a window. The measurement grid will be counted one step
ahead.
With pushing the key <N.column> you can add a new column in the grid.
The button <UNDO> erases an already stored measurement point. The grid will be
counted one step back (with maybe taking back a column).
<ESCAPE> returns to the menu item measurement array.
4.2.2.2 Show measurement value (measurement array)
Measurement arrays are capable to be displayed as
single values likewise index cards (Menu item Value)
as well as a graphic (Menu item Graphic). Condition
to display an array as graphic is the existence of at
least two columns and two rows. The graphic size is
adjusted automatically.
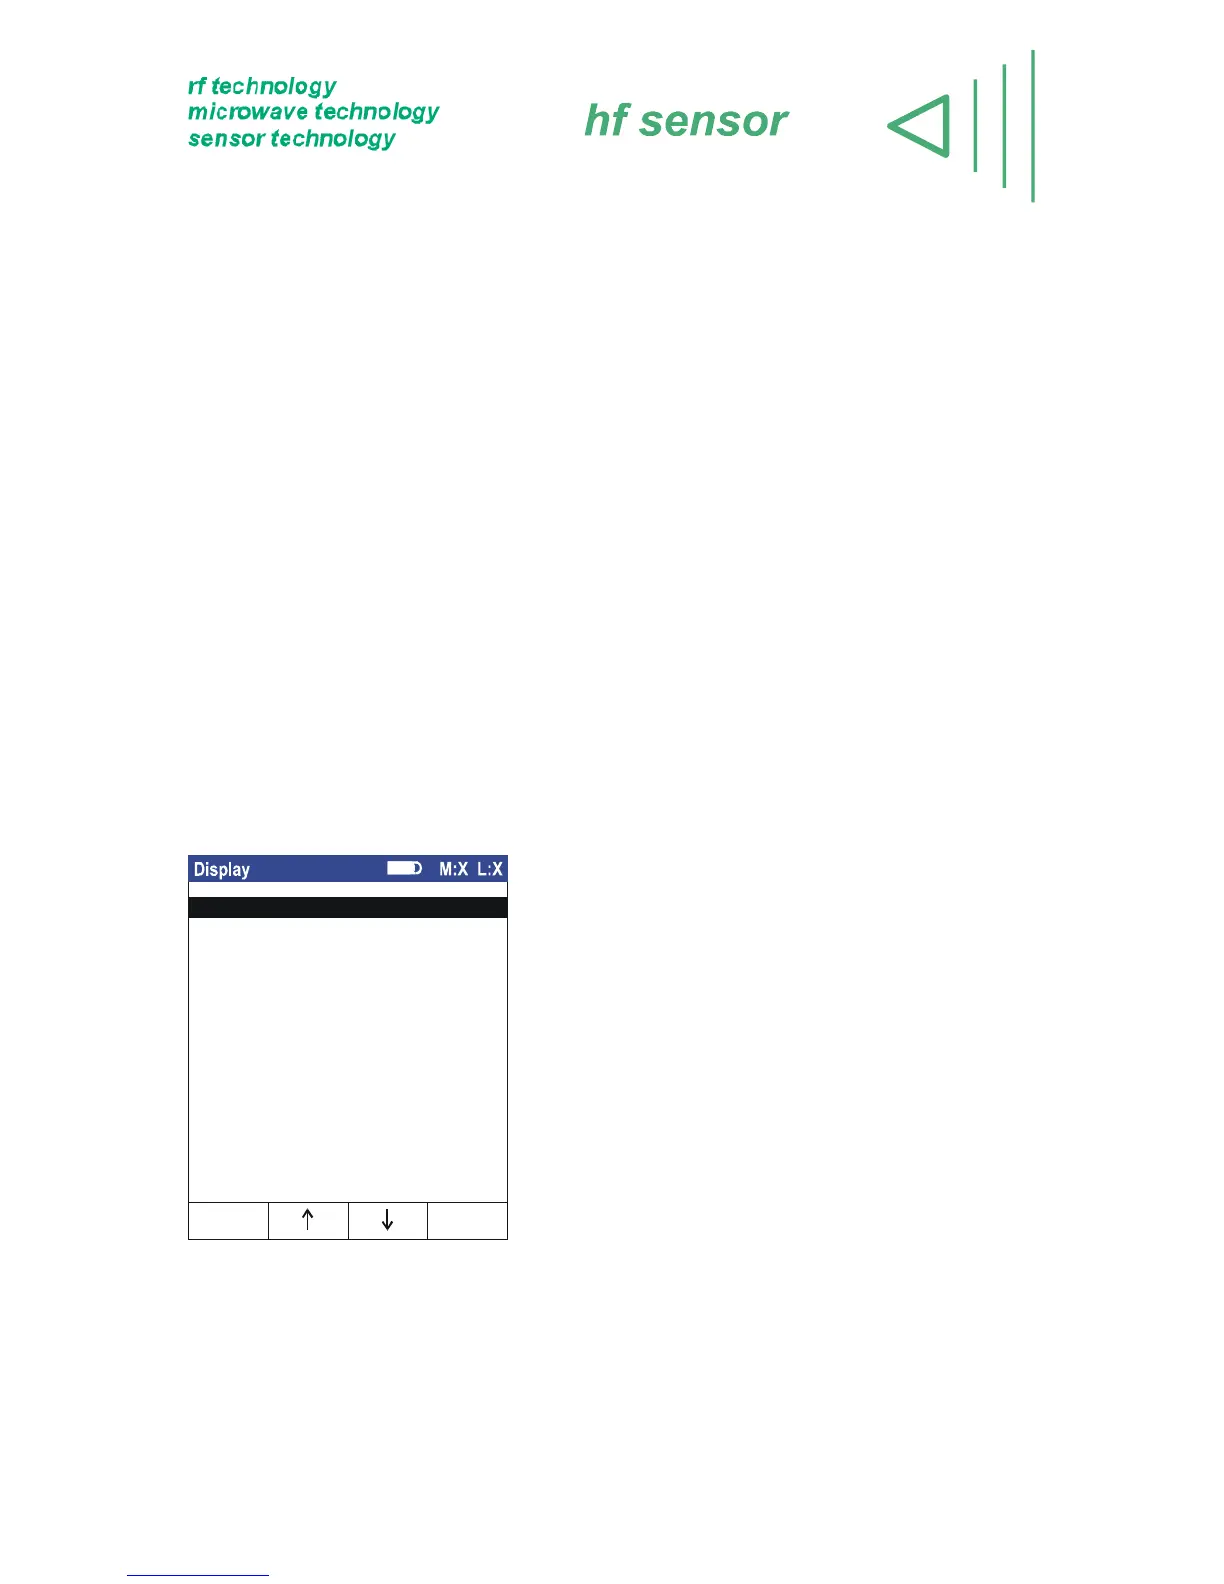
Figure 9 – Menu item show measurement value (measurement array)
1. Value
Here, the single measurement points are displayed like a card index.
Graphic
Statistics
Set indicating range
Colour profile
OKEscape
Value
Grid ...
 Loading...