Discovery QDR Series Technical Manual
9-3
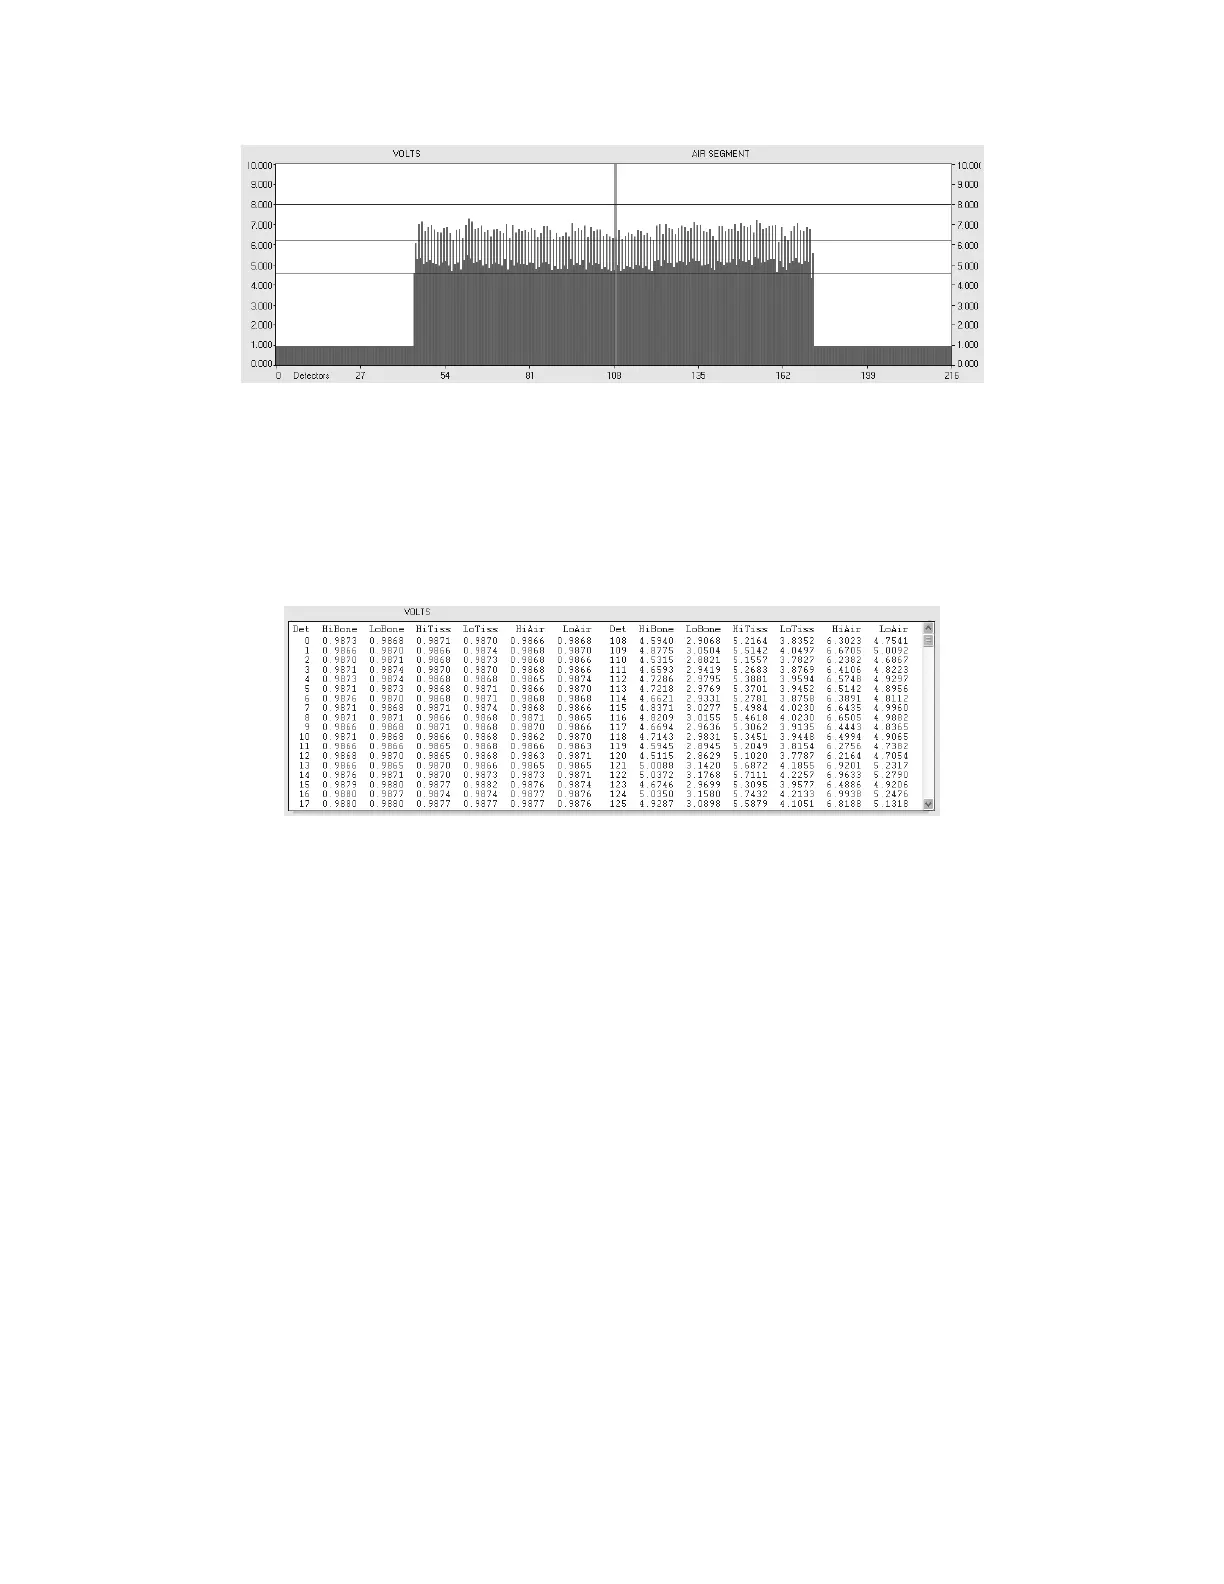
Figure 9-3. X-Ray Data as a Bar Graph
When the Table button is active and the system is producing X-Rays, numeric data is
preserved (see
Figure 9-3). A label above the left half of the graph indicates which value is
being displayed (for field engineering purpose this will always be Volts). The display has a
vertical scroll bar on the right because only a sixth of the data for all of the detectors is
showing at one time.
Figure 9-4. X-Ray Data as a Raw Data
9.1.3 The Display Controls
9.1.3.1 The Display Controls
The Display Controls can be broken into four functional areas:
• Controls starting with Xrays (F2) OFF/ON
• Controls starting with Test Signals
• Controls starting with Display
• Controls starting with Status Bits